| __timestamp | Stanley Black & Decker, Inc. | United Airlines Holdings, Inc. |
|---|---|---|
| Wednesday, January 1, 2014 | 7235900000 | 29569000000 |
| Thursday, January 1, 2015 | 7099800000 | 25952000000 |
| Friday, January 1, 2016 | 7139700000 | 24856000000 |
| Sunday, January 1, 2017 | 7969200000 | 27056000000 |
| Monday, January 1, 2018 | 9080500000 | 30165000000 |
| Tuesday, January 1, 2019 | 9636700000 | 30786000000 |
| Wednesday, January 1, 2020 | 9566700000 | 20385000000 |
| Friday, January 1, 2021 | 10423000000 | 23913000000 |
| Saturday, January 1, 2022 | 12663300000 | 34315000000 |
| Sunday, January 1, 2023 | 11683100000 | 38518000000 |
| Monday, January 1, 2024 | 10851300000 | 37643000000 |
Unleashing insights
In the ever-evolving landscape of corporate efficiency, comparing the cost of revenue between United Airlines Holdings, Inc. and Stanley Black & Decker, Inc. offers a fascinating glimpse into the operational dynamics of two distinct industries. From 2014 to 2023, United Airlines consistently reported a higher cost of revenue, peaking at approximately $38.5 billion in 2023, a 30% increase from its 2014 figures. This reflects the airline industry's capital-intensive nature and its susceptibility to fluctuating fuel prices and labor costs.
Conversely, Stanley Black & Decker, a leader in the tools and storage sector, demonstrated a more stable cost of revenue trajectory, with a notable 62% increase over the same period, reaching around $11.7 billion in 2023. This stability underscores the manufacturing sector's resilience and efficiency in managing production costs. Such insights are crucial for investors and analysts seeking to understand industry-specific challenges and opportunities.
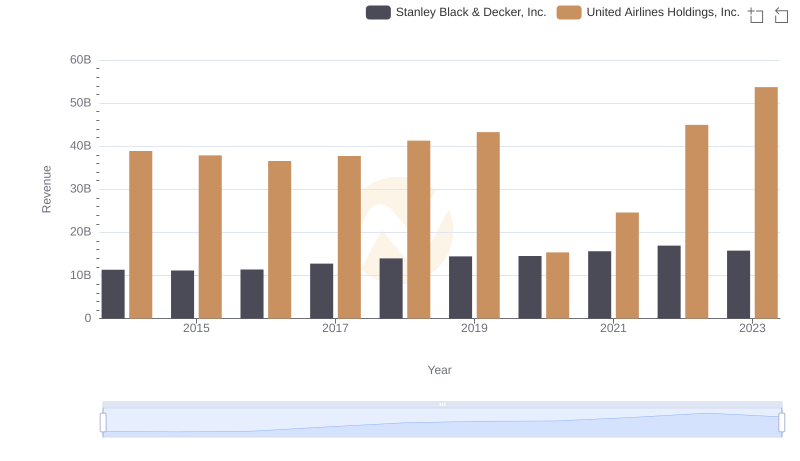
Breaking Down Revenue Trends: United Airlines Holdings, Inc. vs Stanley Black & Decker, Inc.
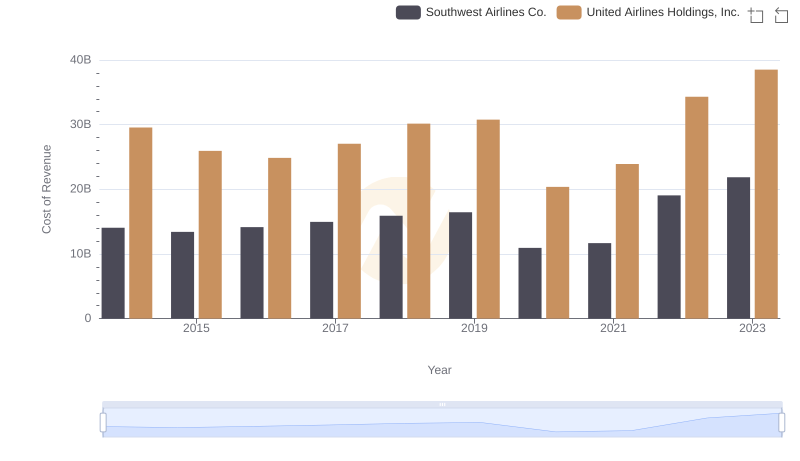
Cost of Revenue Trends: United Airlines Holdings, Inc. vs Southwest Airlines Co.
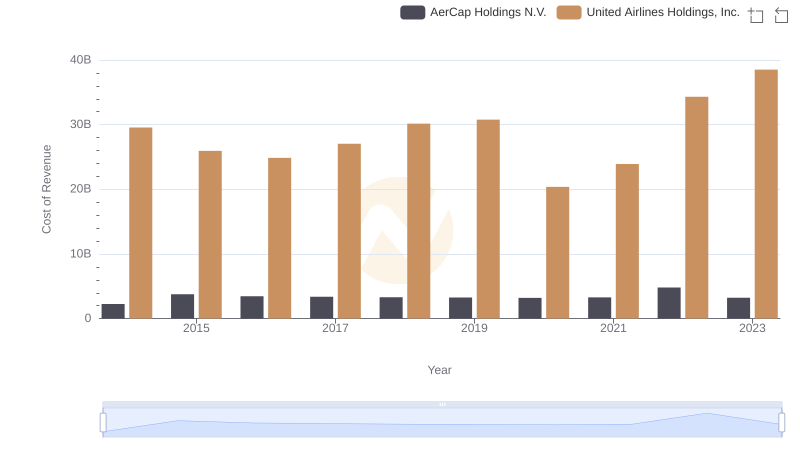
Analyzing Cost of Revenue: United Airlines Holdings, Inc. and AerCap Holdings N.V.
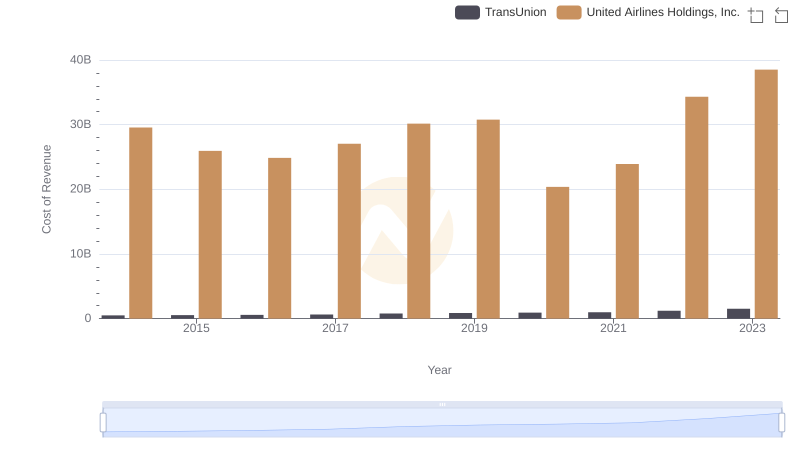
United Airlines Holdings, Inc. vs TransUnion: Efficiency in Cost of Revenue Explored
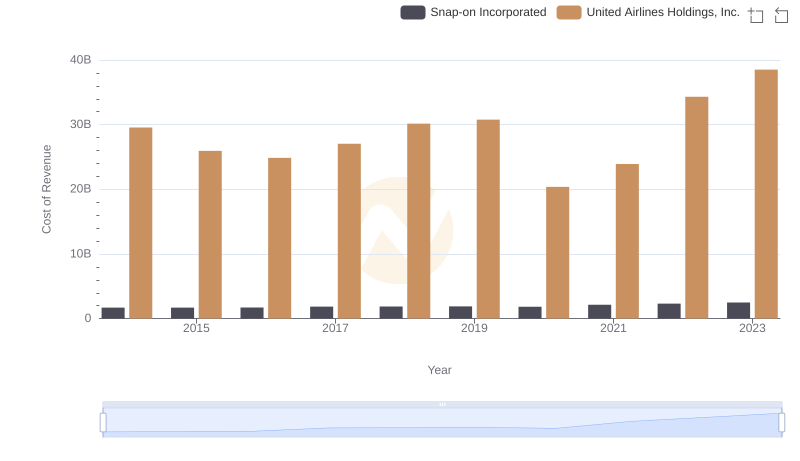
United Airlines Holdings, Inc. vs Snap-on Incorporated: Efficiency in Cost of Revenue Explored
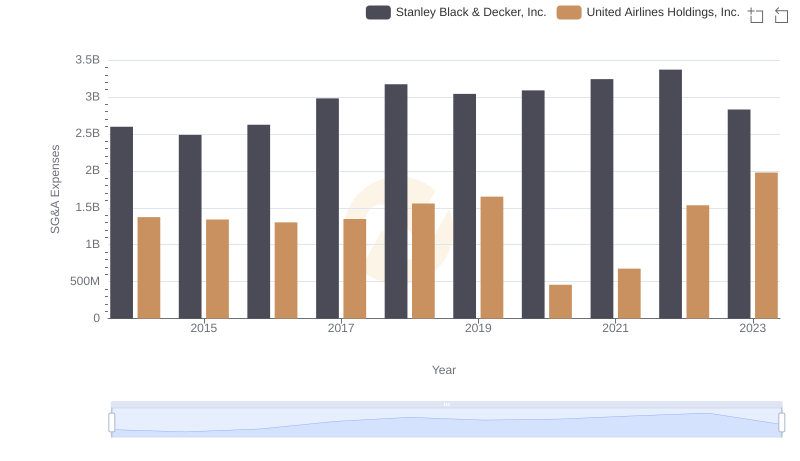
Cost Management Insights: SG&A Expenses for United Airlines Holdings, Inc. and Stanley Black & Decker, Inc.
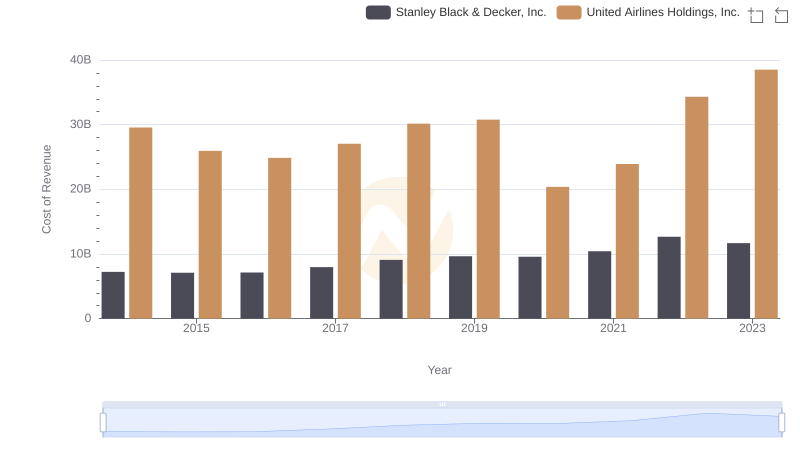
United Airlines Holdings, Inc. vs Stanley Black & Decker, Inc.: Efficiency in Cost of Revenue Explored