| __timestamp | AerCap Holdings N.V. | United Airlines Holdings, Inc. |
|---|---|---|
| Wednesday, January 1, 2014 | 2252878000 | 29569000000 |
| Thursday, January 1, 2015 | 3776407000 | 25952000000 |
| Friday, January 1, 2016 | 3465727000 | 24856000000 |
| Sunday, January 1, 2017 | 3377439000 | 27056000000 |
| Monday, January 1, 2018 | 3299635000 | 30165000000 |
| Tuesday, January 1, 2019 | 3259091000 | 30786000000 |
| Wednesday, January 1, 2020 | 3217133000 | 20385000000 |
| Friday, January 1, 2021 | 3287413000 | 23913000000 |
| Saturday, January 1, 2022 | 4805277000 | 34315000000 |
| Sunday, January 1, 2023 | 3237016000 | 38518000000 |
| Monday, January 1, 2024 | 37643000000 |
Data in motion
In the ever-evolving landscape of aviation and leasing, United Airlines Holdings, Inc. and AerCap Holdings N.V. stand as titans. Over the past decade, these companies have navigated turbulent skies and shifting economic winds. From 2014 to 2023, United Airlines consistently reported a cost of revenue that dwarfed AerCap's, averaging nearly 10 times higher. This disparity highlights the scale and operational complexity of a major airline compared to a leading aircraft leasing company.
United Airlines' cost of revenue peaked in 2023, marking a 30% increase from its 2020 low, reflecting a robust recovery post-pandemic. Meanwhile, AerCap's cost of revenue saw a significant spike in 2022, rising by 50% from the previous year, possibly due to strategic acquisitions or fleet expansions. These trends underscore the dynamic nature of the aviation industry, where adaptability and strategic foresight are paramount.
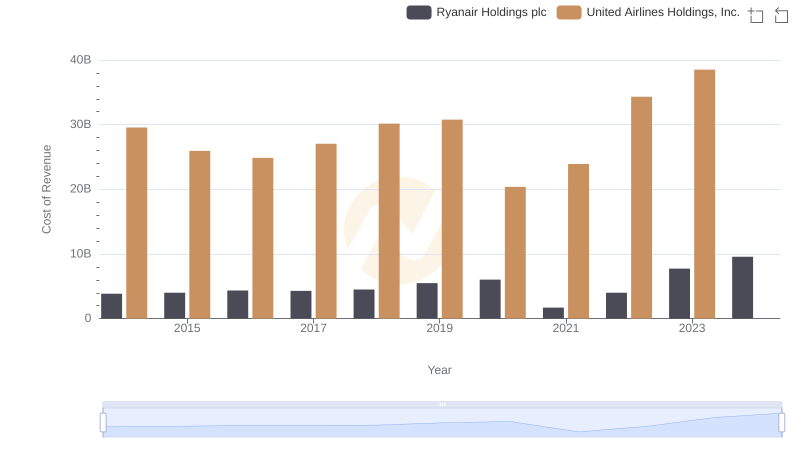
Cost of Revenue: Key Insights for United Airlines Holdings, Inc. and Ryanair Holdings plc
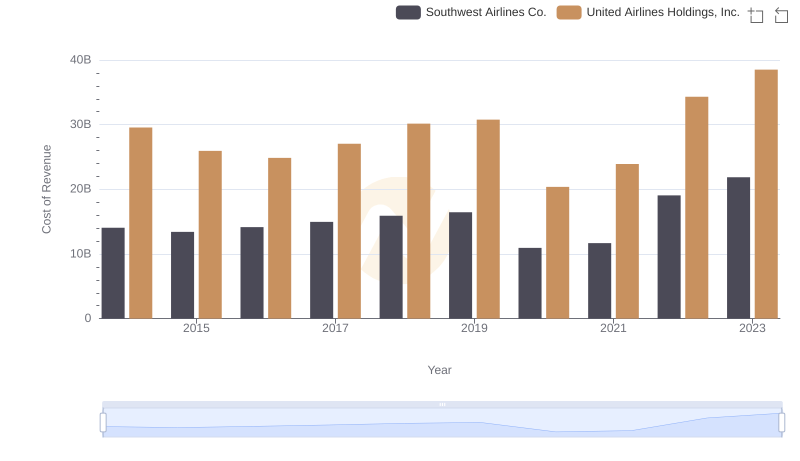
Cost of Revenue Trends: United Airlines Holdings, Inc. vs Southwest Airlines Co.
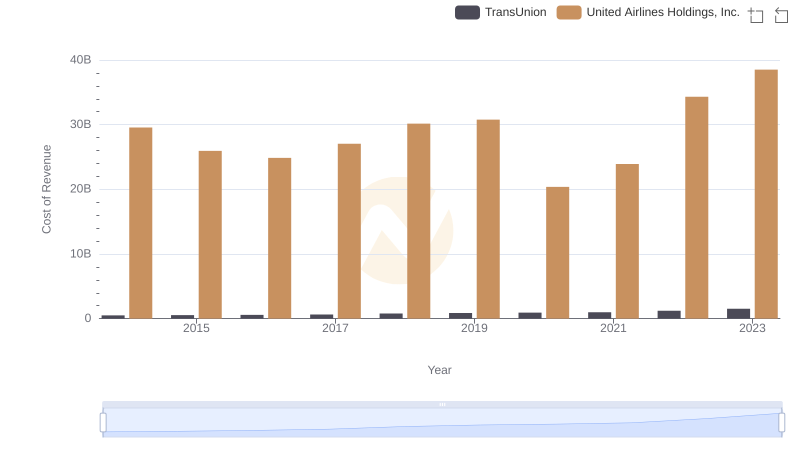
United Airlines Holdings, Inc. vs TransUnion: Efficiency in Cost of Revenue Explored
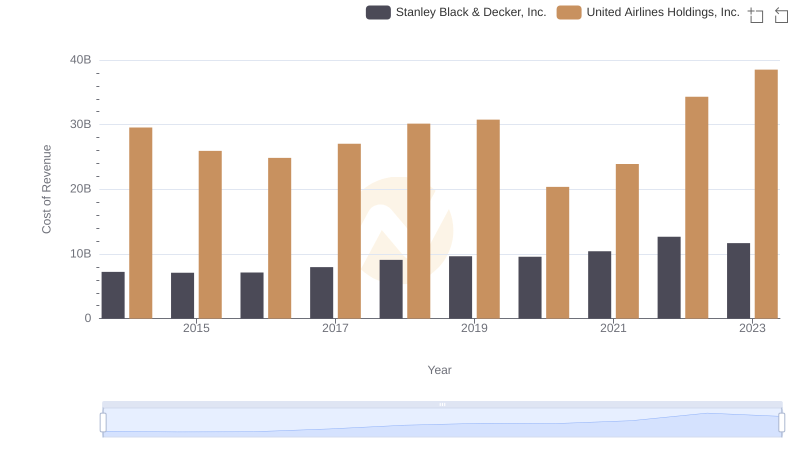
Comparing Cost of Revenue Efficiency: United Airlines Holdings, Inc. vs Stanley Black & Decker, Inc.
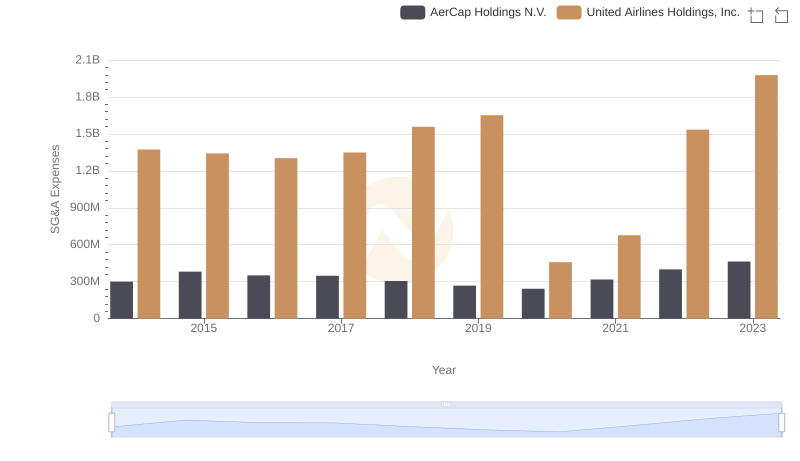
United Airlines Holdings, Inc. or AerCap Holdings N.V.: Who Manages SG&A Costs Better?