| __timestamp | Southwest Airlines Co. | United Airlines Holdings, Inc. |
|---|---|---|
| Wednesday, January 1, 2014 | 14049000000 | 29569000000 |
| Thursday, January 1, 2015 | 13423000000 | 25952000000 |
| Friday, January 1, 2016 | 14151000000 | 24856000000 |
| Sunday, January 1, 2017 | 14968000000 | 27056000000 |
| Monday, January 1, 2018 | 15907000000 | 30165000000 |
| Tuesday, January 1, 2019 | 16445000000 | 30786000000 |
| Wednesday, January 1, 2020 | 10938000000 | 20385000000 |
| Friday, January 1, 2021 | 11675000000 | 23913000000 |
| Saturday, January 1, 2022 | 19062000000 | 34315000000 |
| Sunday, January 1, 2023 | 21868000000 | 38518000000 |
| Monday, January 1, 2024 | 23024000000 | 37643000000 |
Unlocking the unknown
In the competitive skies of the United States, United Airlines Holdings, Inc. and Southwest Airlines Co. have long been industry titans. From 2014 to 2023, these airlines have navigated turbulent economic conditions, with their cost of revenue reflecting their strategic maneuvers. United Airlines, with a 35% increase in cost of revenue over this period, showcases its expansive operations and market reach. Meanwhile, Southwest Airlines, known for its low-cost model, saw a 56% rise, indicating its aggressive expansion and adaptation strategies.
The year 2020 marked a significant downturn for both, with costs plummeting due to the pandemic's impact. However, by 2023, United Airlines rebounded with a 90% increase from its 2020 low, while Southwest surged by 100%. This data underscores the resilience and adaptability of these airlines in the face of global challenges.
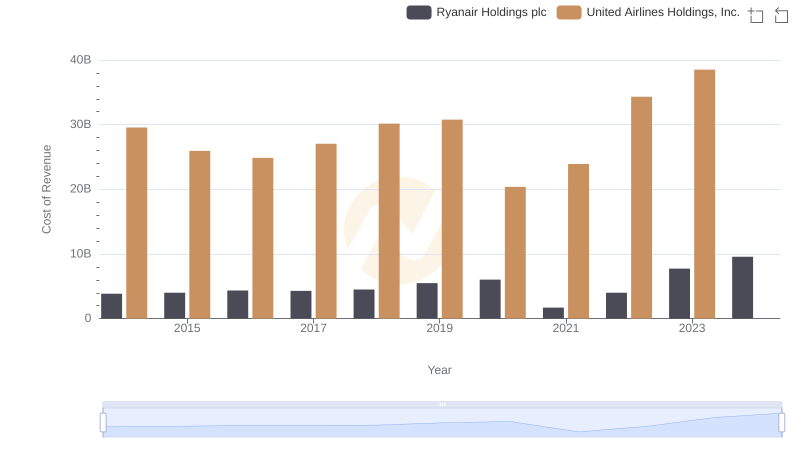
Cost of Revenue: Key Insights for United Airlines Holdings, Inc. and Ryanair Holdings plc
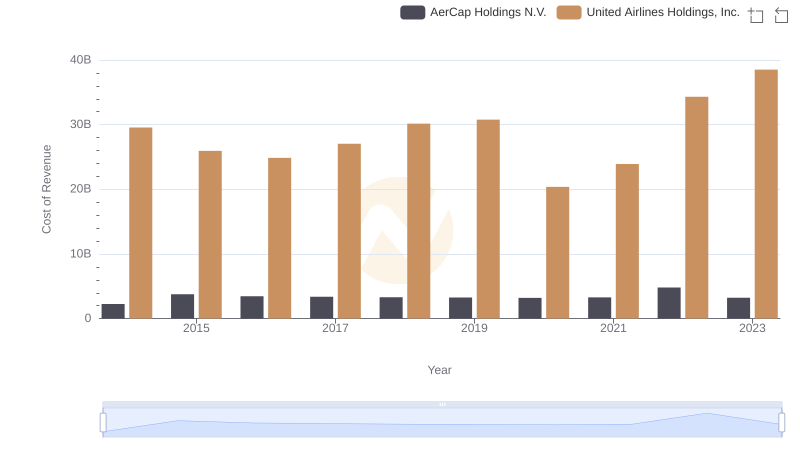
Analyzing Cost of Revenue: United Airlines Holdings, Inc. and AerCap Holdings N.V.
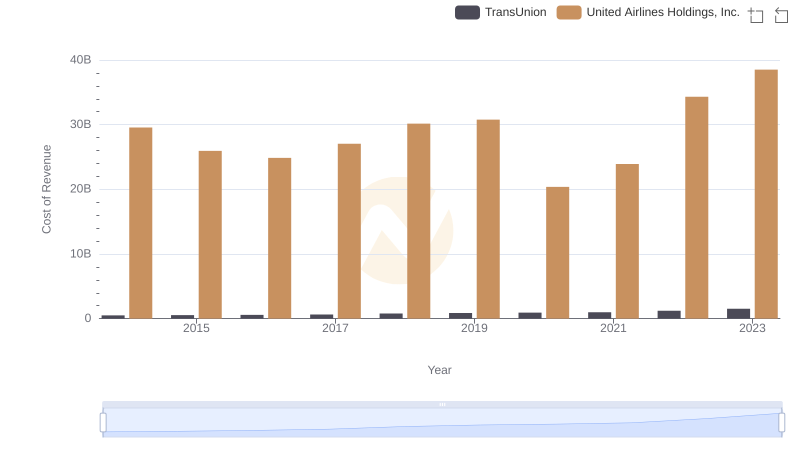
United Airlines Holdings, Inc. vs TransUnion: Efficiency in Cost of Revenue Explored
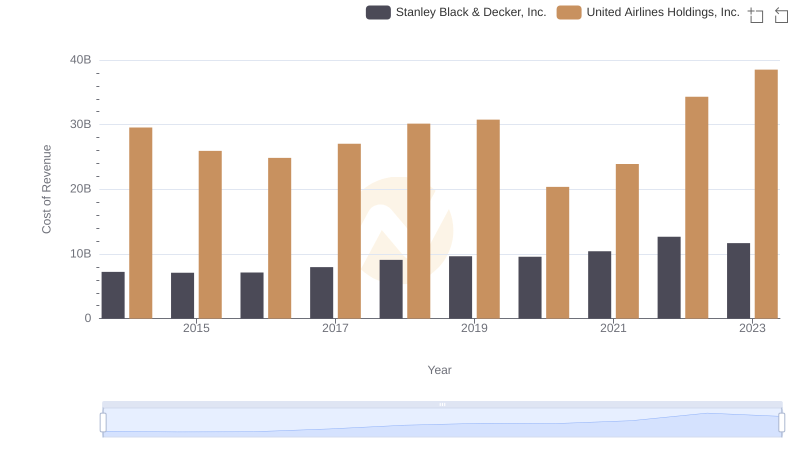
Comparing Cost of Revenue Efficiency: United Airlines Holdings, Inc. vs Stanley Black & Decker, Inc.
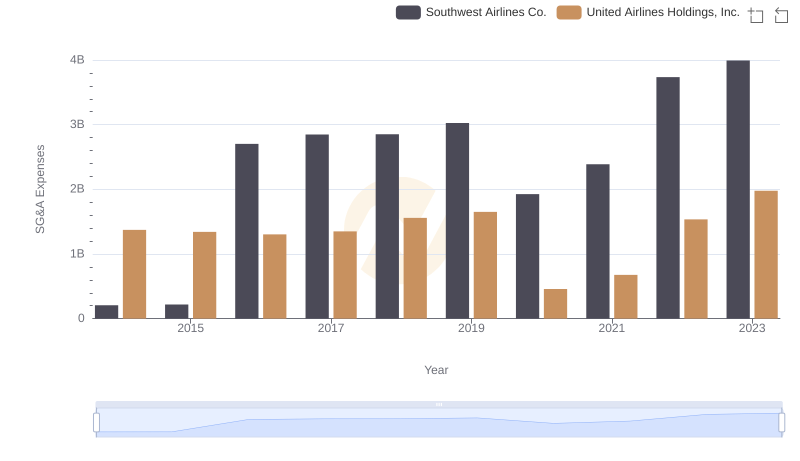
SG&A Efficiency Analysis: Comparing United Airlines Holdings, Inc. and Southwest Airlines Co.