| __timestamp | TransUnion | United Airlines Holdings, Inc. |
|---|---|---|
| Wednesday, January 1, 2014 | 499100000 | 29569000000 |
| Thursday, January 1, 2015 | 531600000 | 25952000000 |
| Friday, January 1, 2016 | 579100000 | 24856000000 |
| Sunday, January 1, 2017 | 645700000 | 27056000000 |
| Monday, January 1, 2018 | 790100000 | 30165000000 |
| Tuesday, January 1, 2019 | 874100000 | 30786000000 |
| Wednesday, January 1, 2020 | 920400000 | 20385000000 |
| Friday, January 1, 2021 | 991600000 | 23913000000 |
| Saturday, January 1, 2022 | 1222900000 | 34315000000 |
| Sunday, January 1, 2023 | 1517300000 | 38518000000 |
| Monday, January 1, 2024 | 0 | 37643000000 |
Data in motion
In the ever-evolving landscape of corporate efficiency, the cost of revenue serves as a critical metric. From 2014 to 2023, United Airlines Holdings, Inc. and TransUnion have showcased contrasting trajectories in managing this vital financial aspect. United Airlines, a titan in the aviation industry, has consistently reported a cost of revenue that dwarfs TransUnion's by nearly 30 times. However, TransUnion, a leader in credit reporting, has demonstrated a steady growth in cost efficiency, with a 204% increase over the decade. Notably, 2020 marked a significant dip for United Airlines, reflecting the global aviation downturn, while TransUnion continued its upward trend. This data underscores the resilience and adaptability of these companies in their respective sectors, offering valuable insights into their operational strategies.
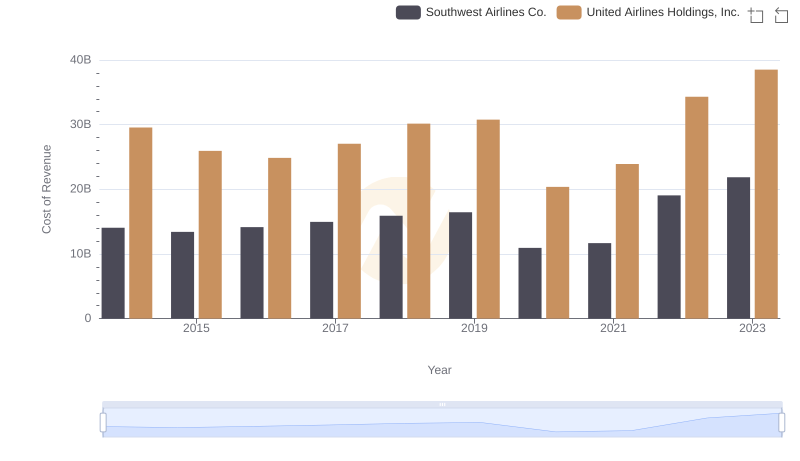
Cost of Revenue Trends: United Airlines Holdings, Inc. vs Southwest Airlines Co.
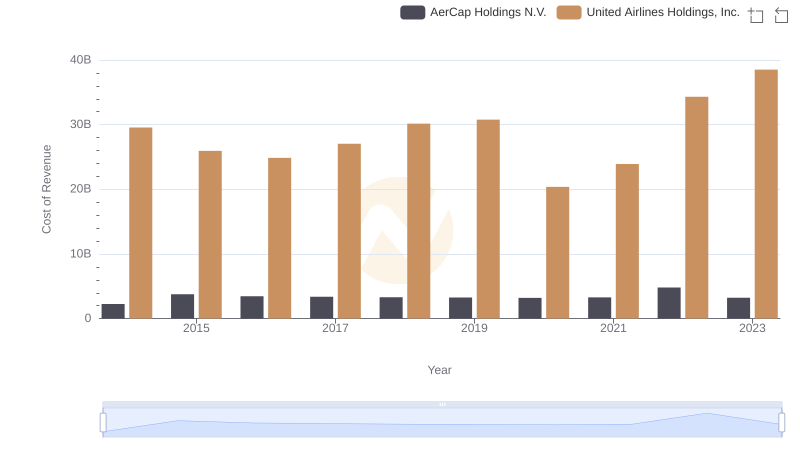
Analyzing Cost of Revenue: United Airlines Holdings, Inc. and AerCap Holdings N.V.
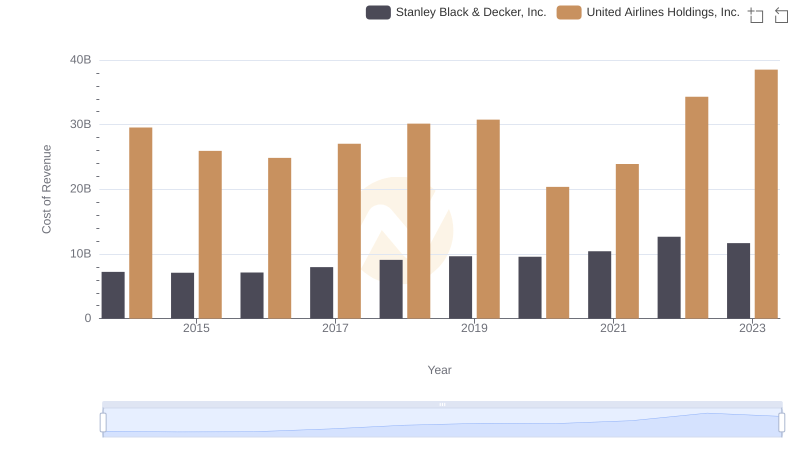
Comparing Cost of Revenue Efficiency: United Airlines Holdings, Inc. vs Stanley Black & Decker, Inc.
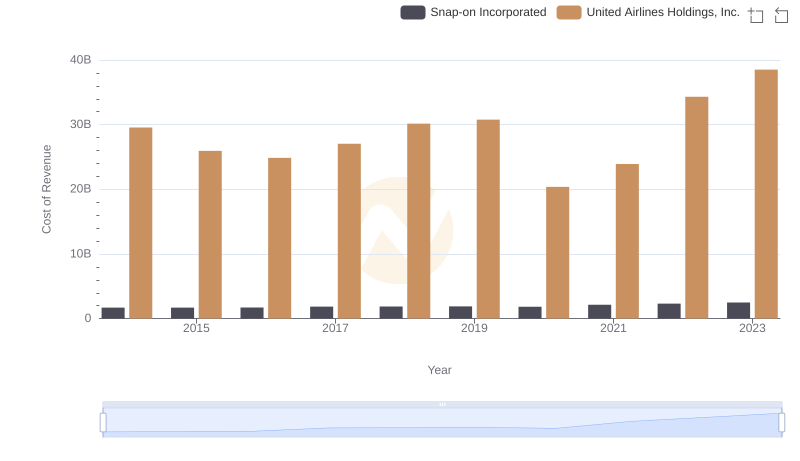
United Airlines Holdings, Inc. vs Snap-on Incorporated: Efficiency in Cost of Revenue Explored
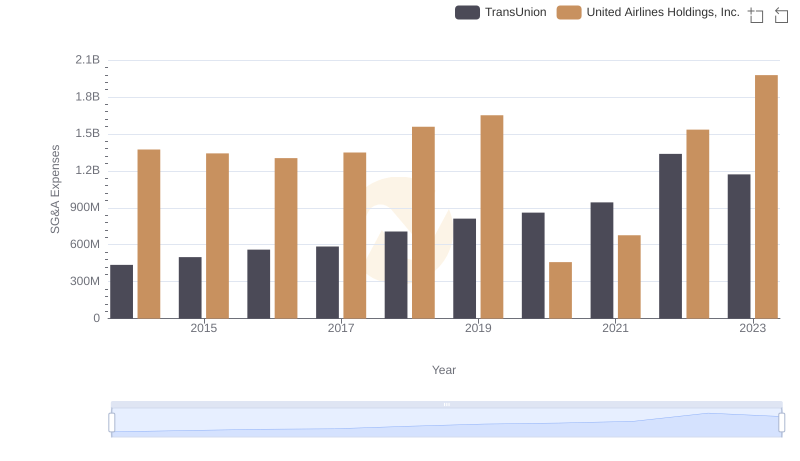
United Airlines Holdings, Inc. vs TransUnion: SG&A Expense Trends