| __timestamp | J.B. Hunt Transport Services, Inc. | United Airlines Holdings, Inc. |
|---|---|---|
| Wednesday, January 1, 2014 | 5124095000 | 29569000000 |
| Thursday, January 1, 2015 | 5041472000 | 25952000000 |
| Friday, January 1, 2016 | 5369826000 | 24856000000 |
| Sunday, January 1, 2017 | 5990275000 | 27056000000 |
| Monday, January 1, 2018 | 7255657000 | 30165000000 |
| Tuesday, January 1, 2019 | 7659003000 | 30786000000 |
| Wednesday, January 1, 2020 | 8186697000 | 20385000000 |
| Friday, January 1, 2021 | 10298483000 | 23913000000 |
| Saturday, January 1, 2022 | 12341472000 | 34315000000 |
| Sunday, January 1, 2023 | 10433277000 | 38518000000 |
| Monday, January 1, 2024 | 37643000000 |
Data in motion
In the ever-evolving landscape of transportation, United Airlines Holdings, Inc. and J.B. Hunt Transport Services, Inc. have showcased intriguing cost of revenue trends over the past decade. From 2014 to 2023, United Airlines experienced a notable fluctuation, with a dip in 2020, likely due to the pandemic, but rebounding by 89% by 2023. Meanwhile, J.B. Hunt steadily increased its cost of revenue by approximately 104% over the same period, reflecting its robust growth in the logistics sector.
While United Airlines' cost of revenue peaked in 2023, J.B. Hunt's consistent upward trajectory highlights its strategic expansion. This comparison underscores the resilience and adaptability of these industry leaders in navigating economic challenges and capitalizing on growth opportunities.
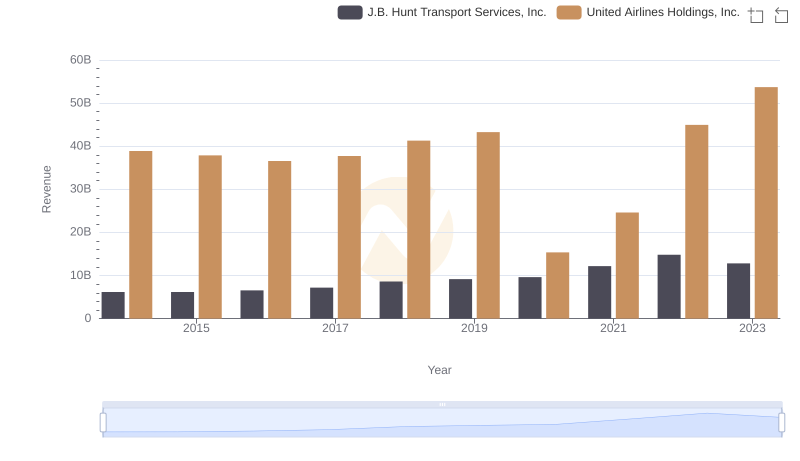
Annual Revenue Comparison: United Airlines Holdings, Inc. vs J.B. Hunt Transport Services, Inc.
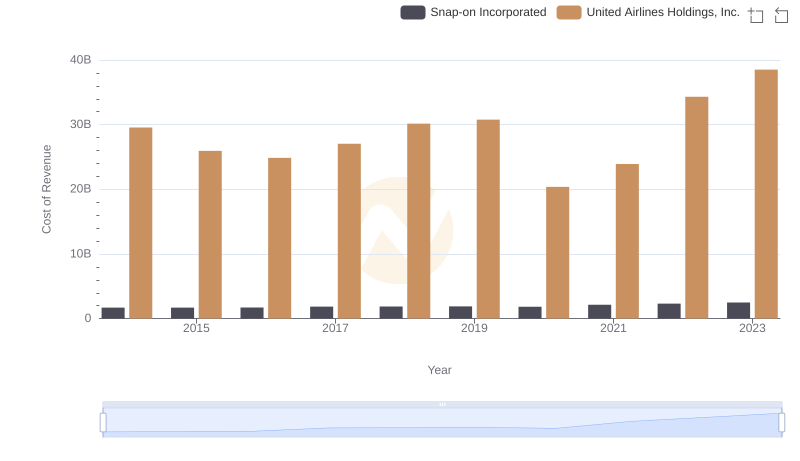
United Airlines Holdings, Inc. vs Snap-on Incorporated: Efficiency in Cost of Revenue Explored
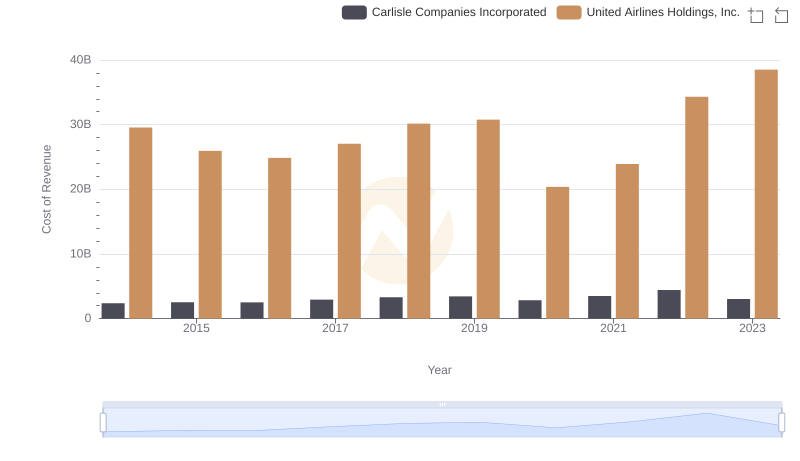
Analyzing Cost of Revenue: United Airlines Holdings, Inc. and Carlisle Companies Incorporated

Cost of Revenue Trends: United Airlines Holdings, Inc. vs Masco Corporation
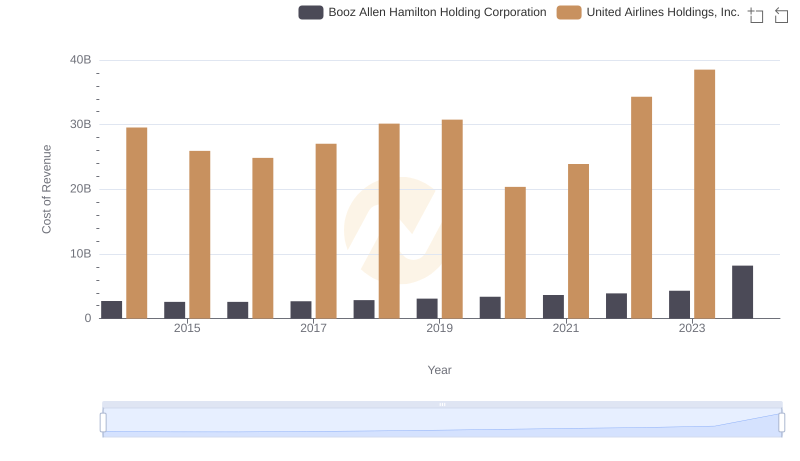
Cost of Revenue Trends: United Airlines Holdings, Inc. vs Booz Allen Hamilton Holding Corporation
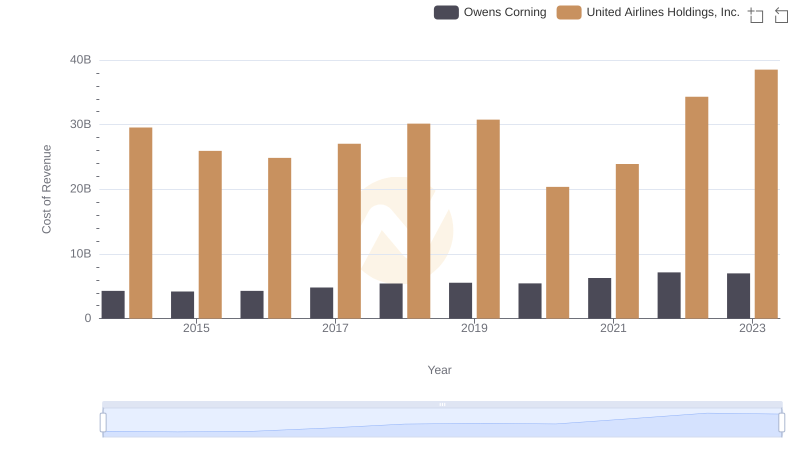
Cost of Revenue: Key Insights for United Airlines Holdings, Inc. and Owens Corning
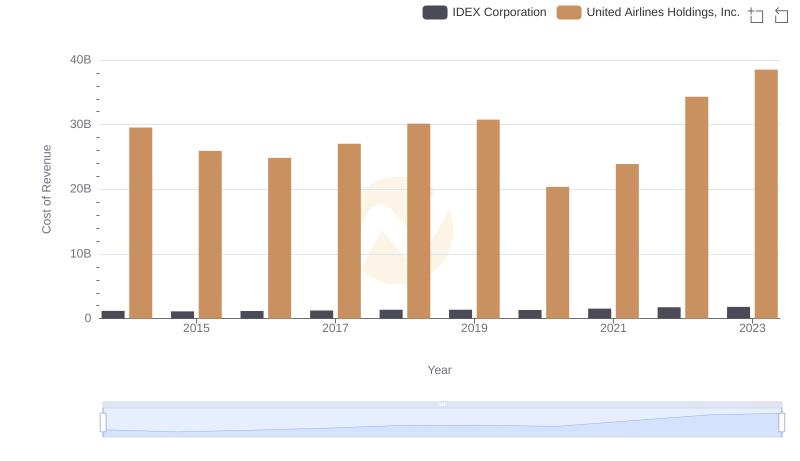
Cost of Revenue Trends: United Airlines Holdings, Inc. vs IDEX Corporation
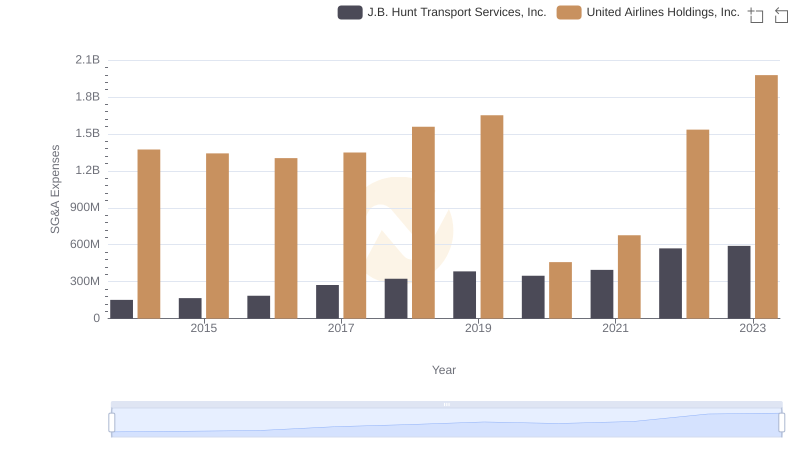
Who Optimizes SG&A Costs Better? United Airlines Holdings, Inc. or J.B. Hunt Transport Services, Inc.