| __timestamp | Owens Corning | United Airlines Holdings, Inc. |
|---|---|---|
| Wednesday, January 1, 2014 | 4300000000 | 29569000000 |
| Thursday, January 1, 2015 | 4197000000 | 25952000000 |
| Friday, January 1, 2016 | 4296000000 | 24856000000 |
| Sunday, January 1, 2017 | 4812000000 | 27056000000 |
| Monday, January 1, 2018 | 5425000000 | 30165000000 |
| Tuesday, January 1, 2019 | 5551000000 | 30786000000 |
| Wednesday, January 1, 2020 | 5445000000 | 20385000000 |
| Friday, January 1, 2021 | 6281000000 | 23913000000 |
| Saturday, January 1, 2022 | 7145000000 | 34315000000 |
| Sunday, January 1, 2023 | 6994000000 | 38518000000 |
| Monday, January 1, 2024 | 37643000000 |
Igniting the spark of knowledge
In the ever-evolving landscape of American industry, United Airlines Holdings, Inc. and Owens Corning stand as titans in their respective fields. From 2014 to 2023, these companies have navigated the turbulent waters of cost management with varying strategies and outcomes.
United Airlines, a leader in the aviation sector, has seen its cost of revenue fluctuate significantly. In 2020, amidst the global pandemic, costs plummeted to 20% below the decade's average, reflecting the industry's challenges. However, by 2023, costs soared to nearly 35% above the 2014 baseline, showcasing a robust recovery and expansion.
Owens Corning, a stalwart in the building materials industry, demonstrated a more stable trajectory. From 2014 to 2023, their cost of revenue increased by approximately 63%, indicating steady growth and adaptation to market demands.
This comparative analysis highlights the dynamic nature of cost management across industries, offering valuable insights for investors and analysts alike.
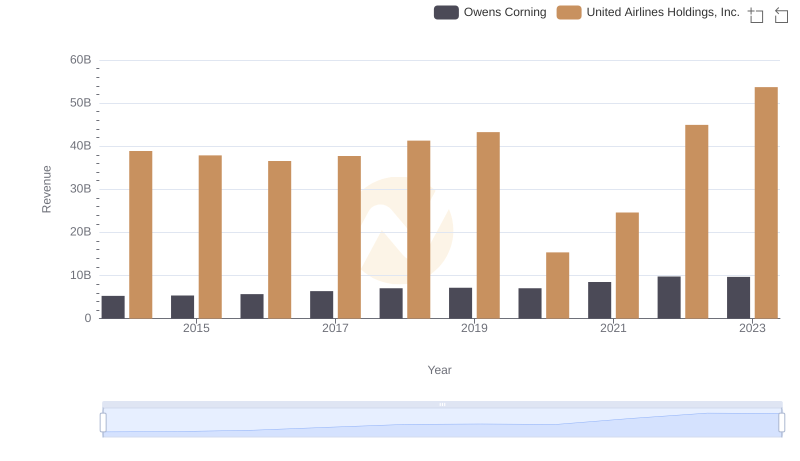
United Airlines Holdings, Inc. or Owens Corning: Who Leads in Yearly Revenue?
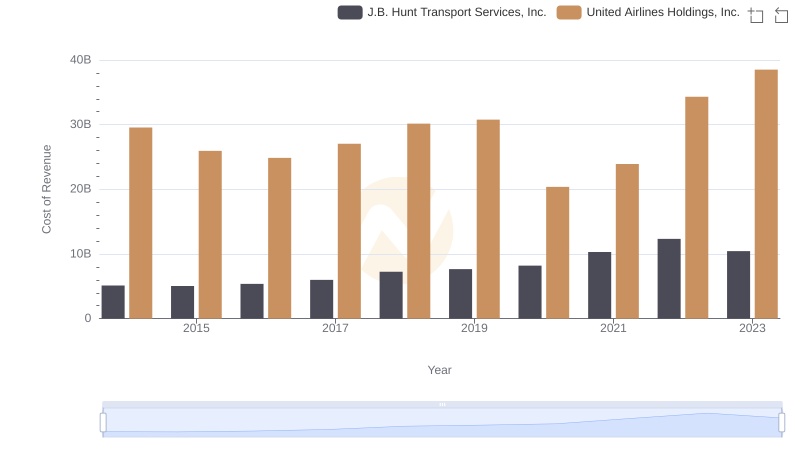
Cost of Revenue Trends: United Airlines Holdings, Inc. vs J.B. Hunt Transport Services, Inc.
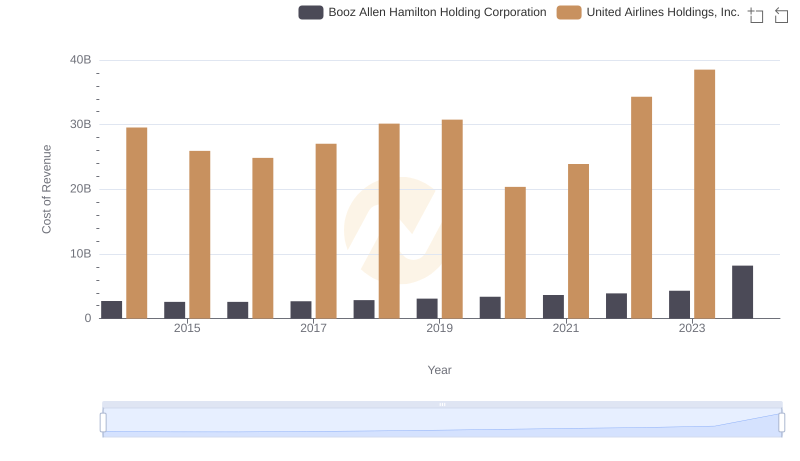
Cost of Revenue Trends: United Airlines Holdings, Inc. vs Booz Allen Hamilton Holding Corporation
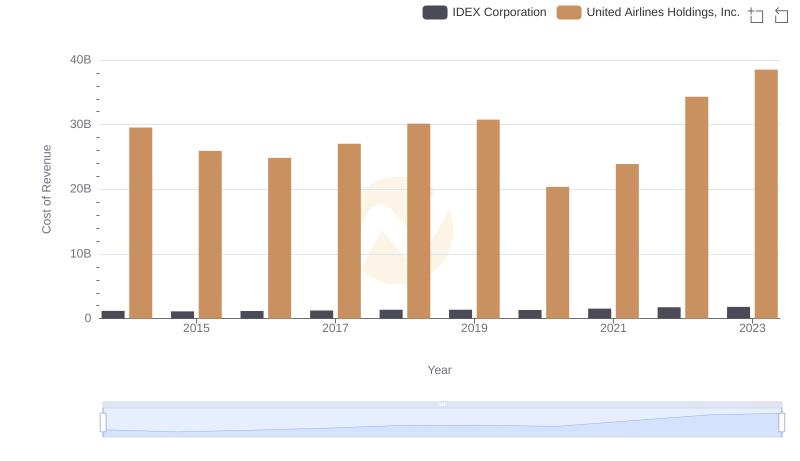
Cost of Revenue Trends: United Airlines Holdings, Inc. vs IDEX Corporation
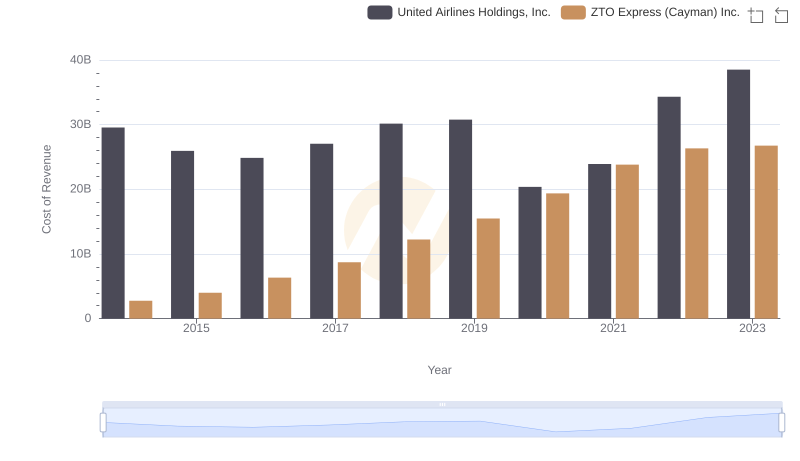
Cost Insights: Breaking Down United Airlines Holdings, Inc. and ZTO Express (Cayman) Inc.'s Expenses