| __timestamp | FedEx Corporation | Union Pacific Corporation |
|---|---|---|
| Wednesday, January 1, 2014 | 36194000000 | 14311000000 |
| Thursday, January 1, 2015 | 38895000000 | 12837000000 |
| Friday, January 1, 2016 | 40037000000 | 11672000000 |
| Sunday, January 1, 2017 | 46511000000 | 12231000000 |
| Monday, January 1, 2018 | 50750000000 | 13293000000 |
| Tuesday, January 1, 2019 | 54866000000 | 12094000000 |
| Wednesday, January 1, 2020 | 55873000000 | 10354000000 |
| Friday, January 1, 2021 | 66005000000 | 11290000000 |
| Saturday, January 1, 2022 | 73345000000 | 13670000000 |
| Sunday, January 1, 2023 | 70989000000 | 13590000000 |
| Monday, January 1, 2024 | 68741000000 | 13211000000 |
Unleashing insights
In the ever-evolving landscape of American industry, Union Pacific Corporation and FedEx Corporation stand as titans in their respective fields. This analysis delves into their cost efficiency over the past decade, focusing on the cost of revenue from 2014 to 2024.
Union Pacific, a leader in rail transportation, has maintained a relatively stable cost of revenue, averaging around $12.6 billion annually. Notably, their cost efficiency peaked in 2020, with a 10% reduction compared to the previous year. Meanwhile, FedEx, a global logistics giant, has seen a more dynamic trend. From 2014 to 2022, FedEx's cost of revenue surged by approximately 103%, reflecting its aggressive expansion and adaptation to e-commerce demands.
This comparative analysis highlights the strategic differences between these corporations, offering insights into their operational efficiencies and market strategies. As we move into 2024, these trends provide a window into the future of American industry.
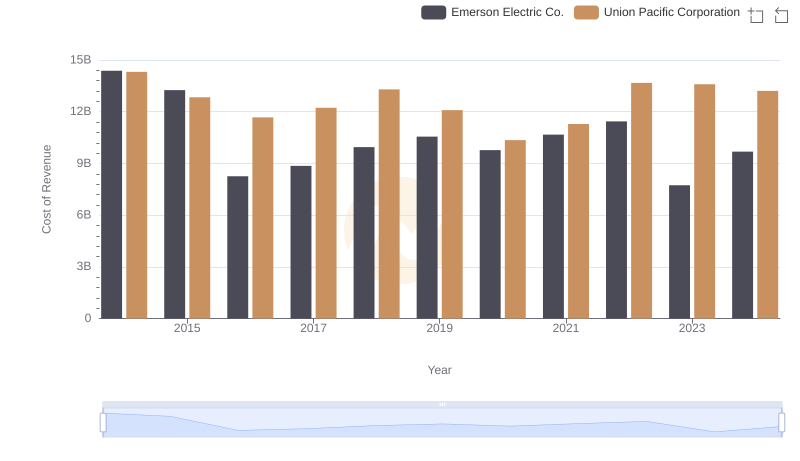
Cost of Revenue Trends: Union Pacific Corporation vs Emerson Electric Co.
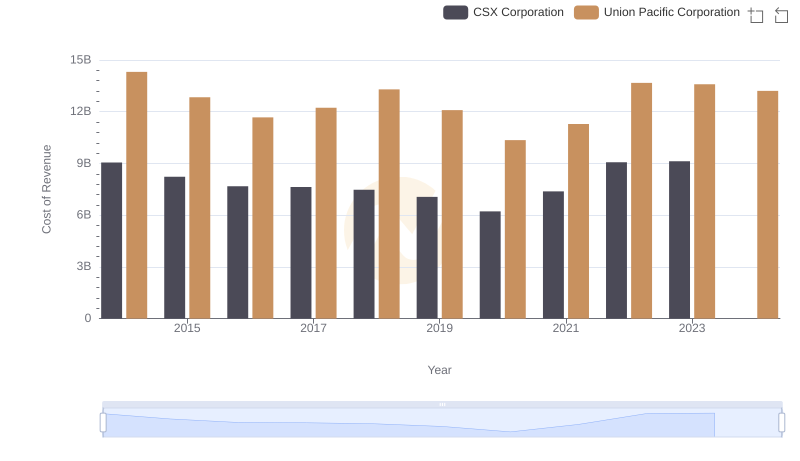
Cost of Revenue Comparison: Union Pacific Corporation vs CSX Corporation
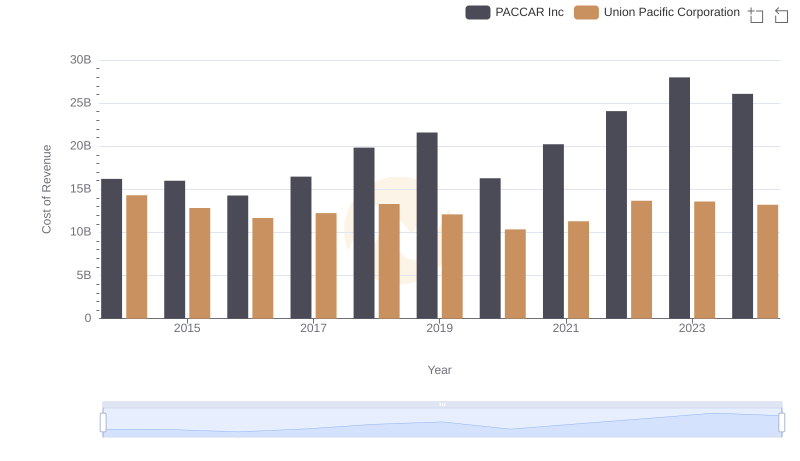
Analyzing Cost of Revenue: Union Pacific Corporation and PACCAR Inc
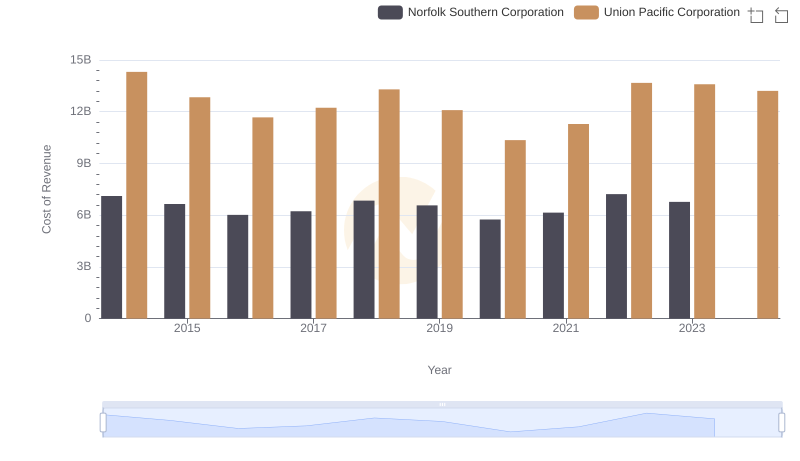
Cost Insights: Breaking Down Union Pacific Corporation and Norfolk Southern Corporation's Expenses
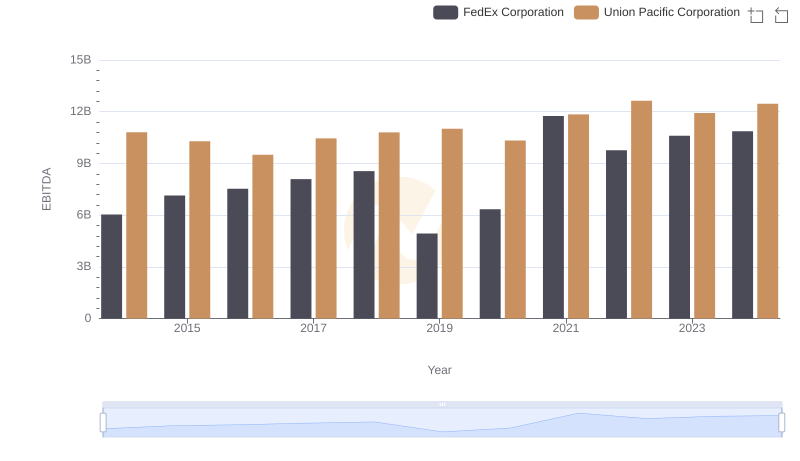
A Professional Review of EBITDA: Union Pacific Corporation Compared to FedEx Corporation