| __timestamp | Johnson Controls International plc | Union Pacific Corporation |
|---|---|---|
| Wednesday, January 1, 2014 | 36201000000 | 14311000000 |
| Thursday, January 1, 2015 | 30732000000 | 12837000000 |
| Friday, January 1, 2016 | 15183000000 | 11672000000 |
| Sunday, January 1, 2017 | 20833000000 | 12231000000 |
| Monday, January 1, 2018 | 22020000000 | 13293000000 |
| Tuesday, January 1, 2019 | 16275000000 | 12094000000 |
| Wednesday, January 1, 2020 | 14906000000 | 10354000000 |
| Friday, January 1, 2021 | 15609000000 | 11290000000 |
| Saturday, January 1, 2022 | 16956000000 | 13670000000 |
| Sunday, January 1, 2023 | 17822000000 | 13590000000 |
| Monday, January 1, 2024 | 14875000000 | 13211000000 |
In pursuit of knowledge
In the ever-evolving landscape of American industry, Union Pacific Corporation and Johnson Controls International plc stand as titans in their respective fields. Over the past decade, these companies have navigated the complexities of cost management with varying strategies and outcomes.
From 2014 to 2024, Johnson Controls International plc experienced a significant fluctuation in its cost of revenue, peaking in 2014 with a staggering 36% higher cost compared to 2024. This reflects a strategic shift, possibly towards more efficient operations. Meanwhile, Union Pacific Corporation maintained a more stable trajectory, with its cost of revenue decreasing by approximately 8% over the same period.
The data suggests that while Johnson Controls has been aggressively optimizing its cost structure, Union Pacific has focused on steady, incremental improvements. This comparison offers a fascinating glimpse into how two industry leaders manage their financial strategies in a competitive market.
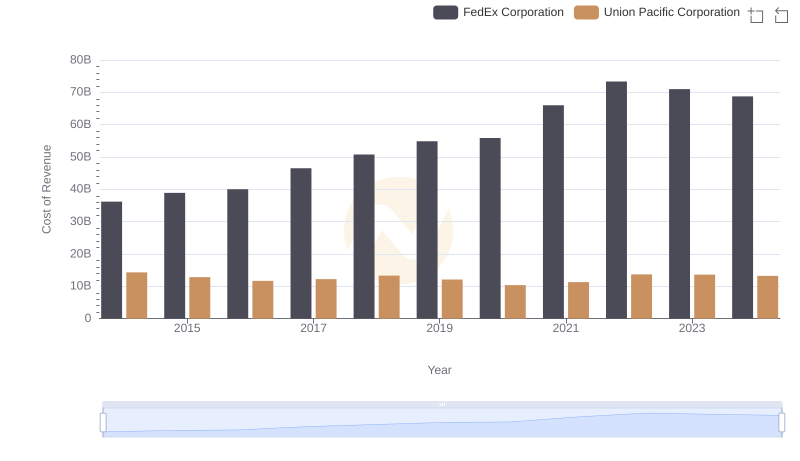
Union Pacific Corporation vs FedEx Corporation: Efficiency in Cost of Revenue Explored
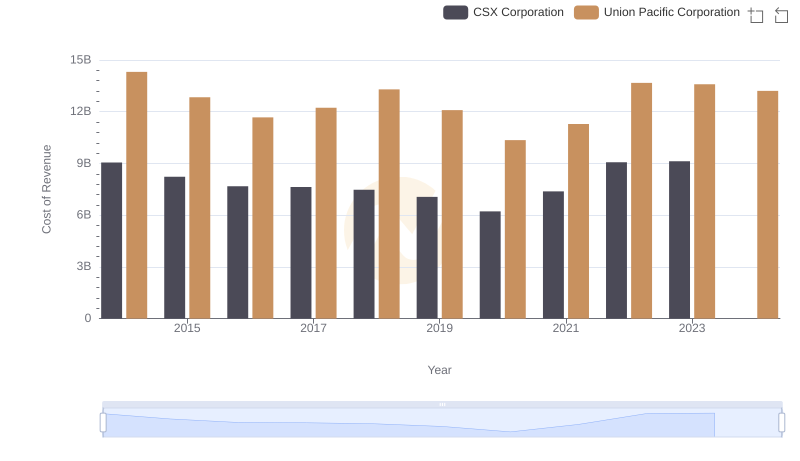
Cost of Revenue Comparison: Union Pacific Corporation vs CSX Corporation
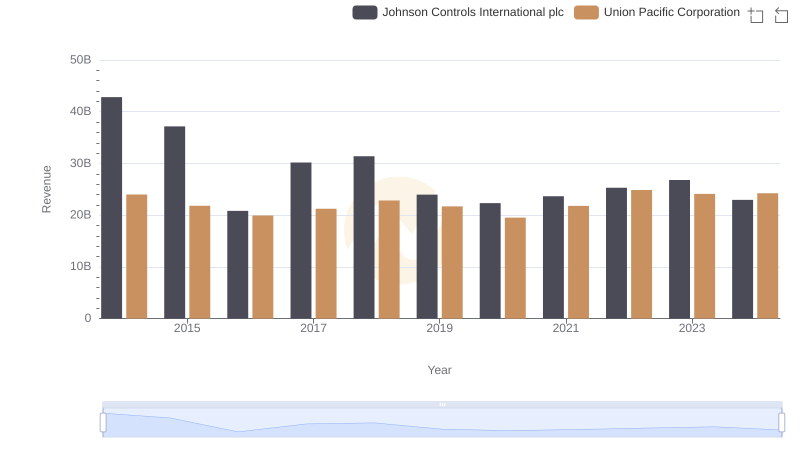
Comparing Revenue Performance: Union Pacific Corporation or Johnson Controls International plc?
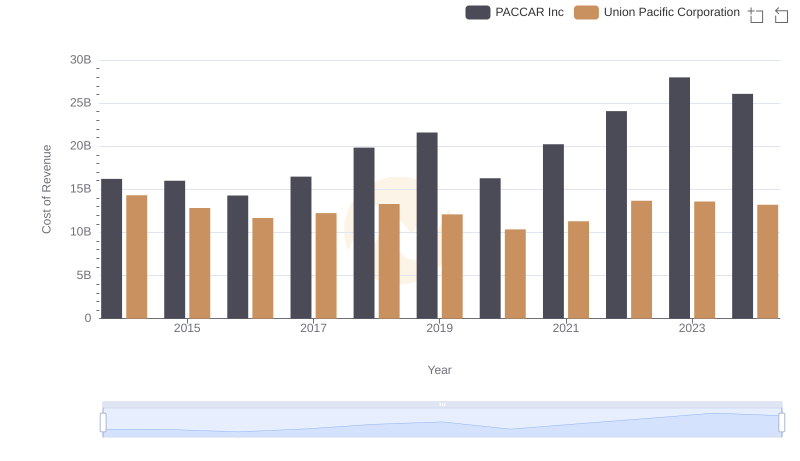
Analyzing Cost of Revenue: Union Pacific Corporation and PACCAR Inc
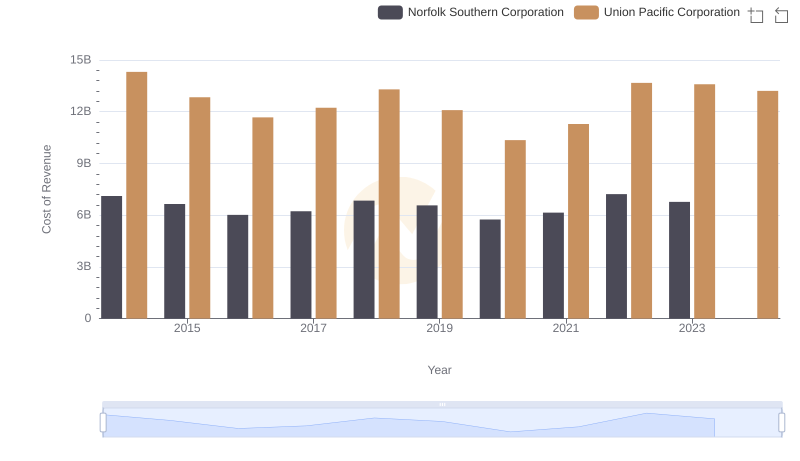
Cost Insights: Breaking Down Union Pacific Corporation and Norfolk Southern Corporation's Expenses
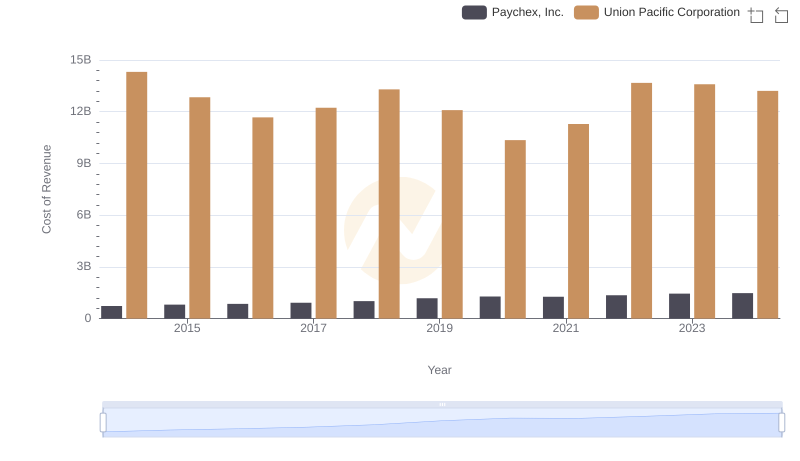
Analyzing Cost of Revenue: Union Pacific Corporation and Paychex, Inc.
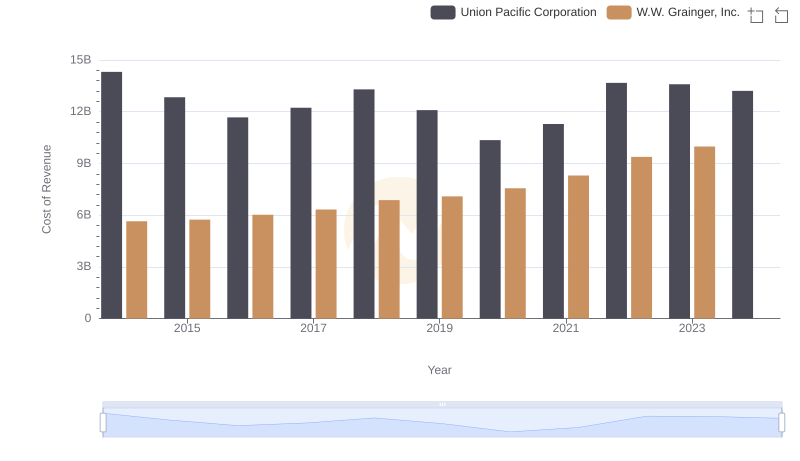
Analyzing Cost of Revenue: Union Pacific Corporation and W.W. Grainger, Inc.
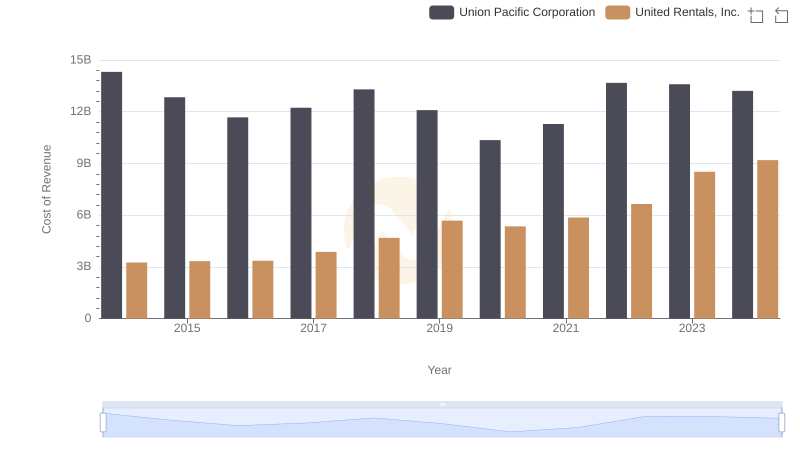
Cost of Revenue Comparison: Union Pacific Corporation vs United Rentals, Inc.