| __timestamp | Union Pacific Corporation | W.W. Grainger, Inc. |
|---|---|---|
| Wednesday, January 1, 2014 | 14311000000 | 5650711000 |
| Thursday, January 1, 2015 | 12837000000 | 5741956000 |
| Friday, January 1, 2016 | 11672000000 | 6022647000 |
| Sunday, January 1, 2017 | 12231000000 | 6327301000 |
| Monday, January 1, 2018 | 13293000000 | 6873000000 |
| Tuesday, January 1, 2019 | 12094000000 | 7089000000 |
| Wednesday, January 1, 2020 | 10354000000 | 7559000000 |
| Friday, January 1, 2021 | 11290000000 | 8302000000 |
| Saturday, January 1, 2022 | 13670000000 | 9379000000 |
| Sunday, January 1, 2023 | 13590000000 | 9982000000 |
| Monday, January 1, 2024 | 13211000000 | 10410000000 |
Data in motion
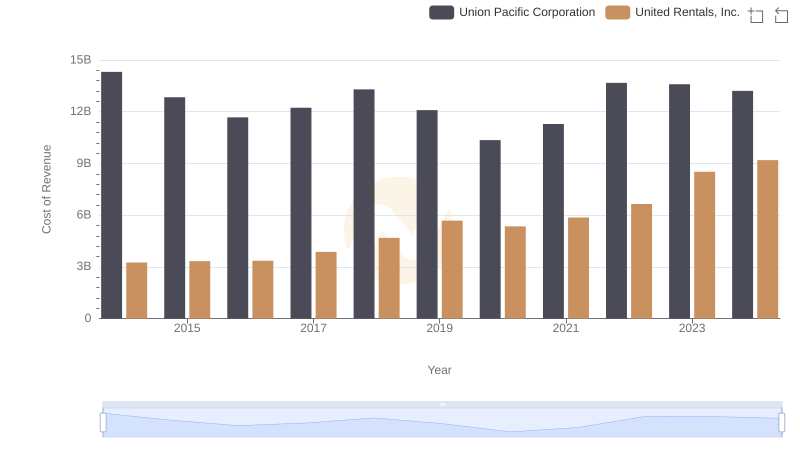
In the ever-evolving landscape of American industry, understanding the cost of revenue is crucial for evaluating a company's financial health. Union Pacific Corporation, a titan in the railroad sector, and W.W. Grainger, Inc., a leader in industrial supply, offer a fascinating comparison. From 2014 to 2023, Union Pacific's cost of revenue fluctuated, peaking in 2014 and 2022, with a notable dip in 2020, reflecting a 28% decrease from its 2014 high. Meanwhile, W.W. Grainger's cost of revenue steadily increased, showcasing a 77% rise over the same period. This trend highlights Grainger's expanding market presence and operational scale. However, data for 2024 is incomplete, leaving room for speculation on future trajectories. This analysis underscores the dynamic nature of these industries and the importance of strategic cost management.
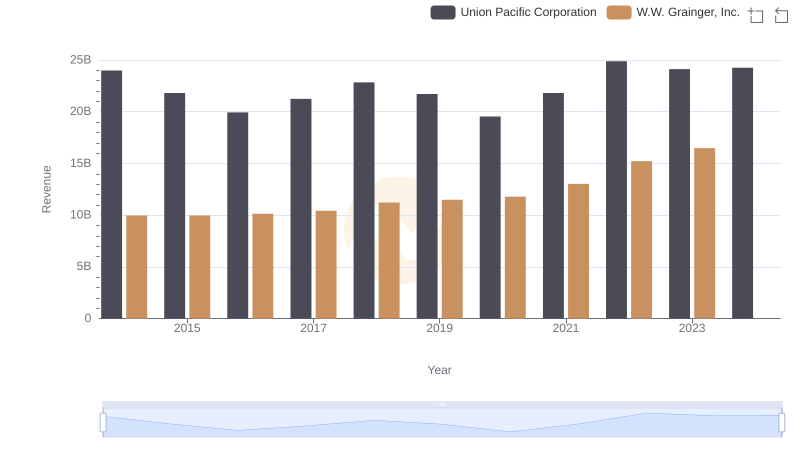
Breaking Down Revenue Trends: Union Pacific Corporation vs W.W. Grainger, Inc.
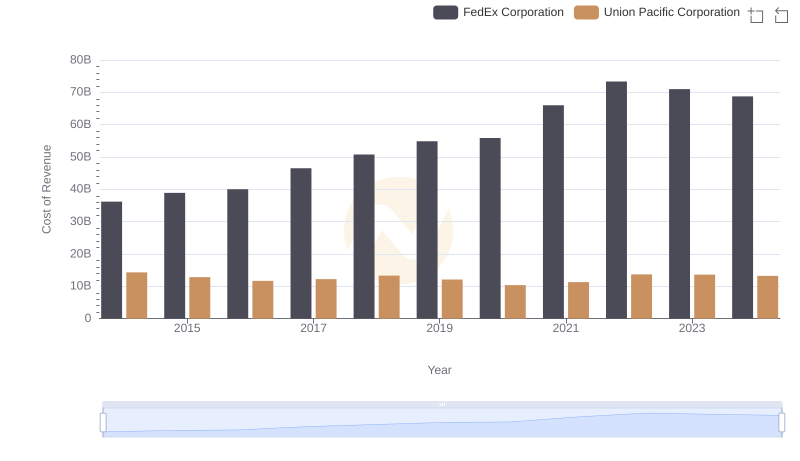
Union Pacific Corporation vs FedEx Corporation: Efficiency in Cost of Revenue Explored
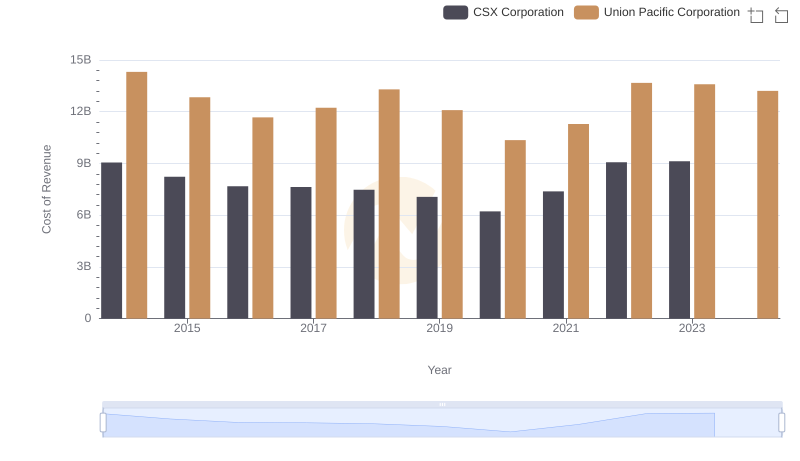
Cost of Revenue Comparison: Union Pacific Corporation vs CSX Corporation
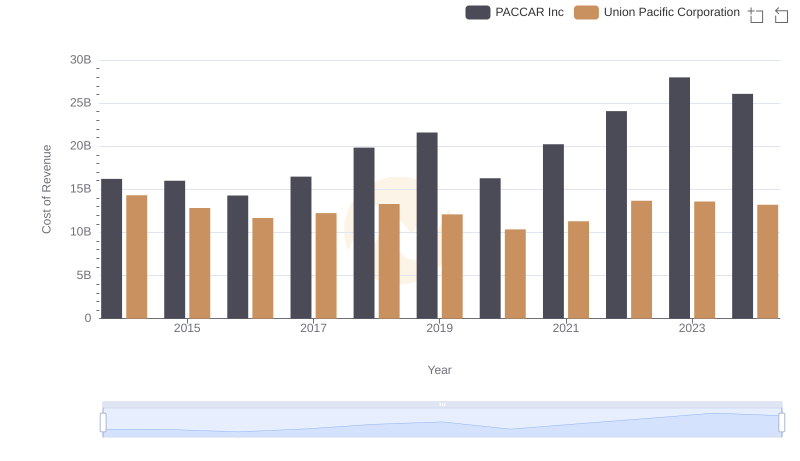
Analyzing Cost of Revenue: Union Pacific Corporation and PACCAR Inc
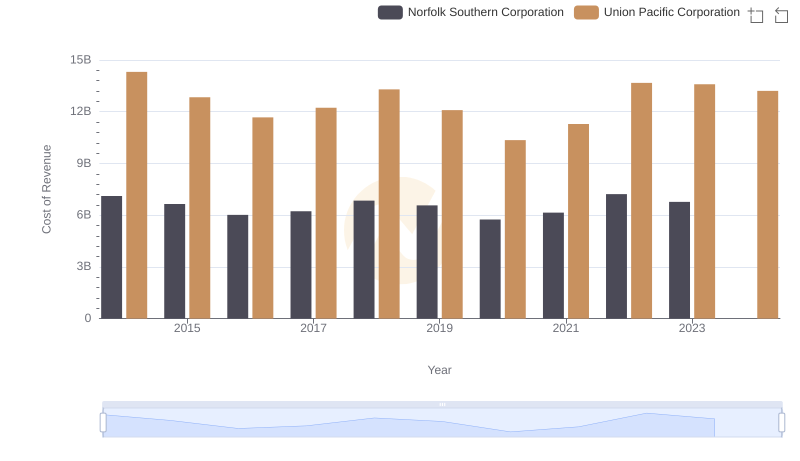
Cost Insights: Breaking Down Union Pacific Corporation and Norfolk Southern Corporation's Expenses
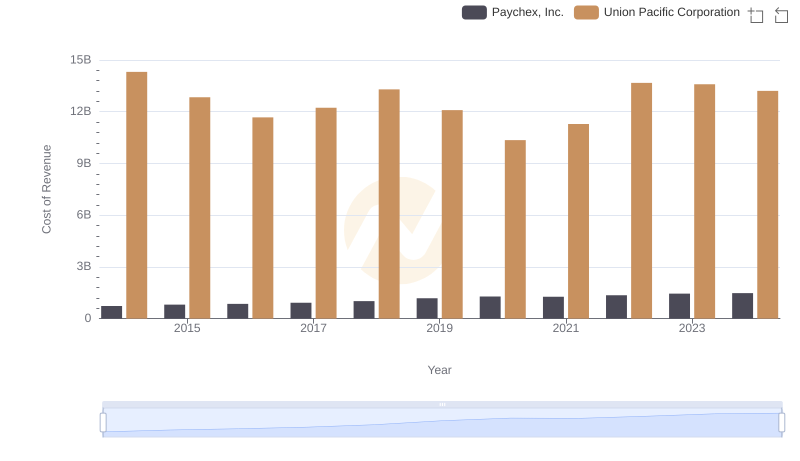
Analyzing Cost of Revenue: Union Pacific Corporation and Paychex, Inc.
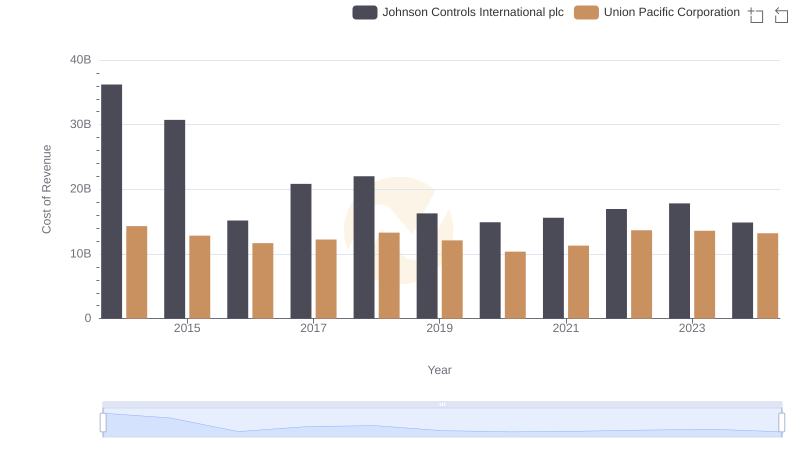
Cost of Revenue Comparison: Union Pacific Corporation vs Johnson Controls International plc
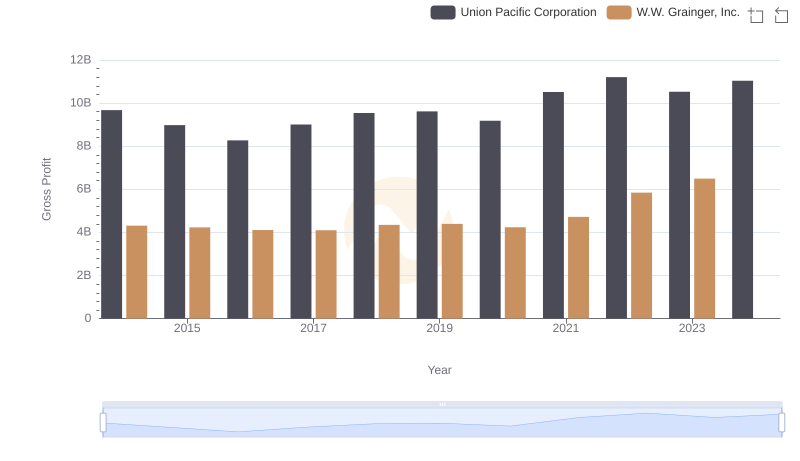
Union Pacific Corporation and W.W. Grainger, Inc.: A Detailed Gross Profit Analysis
Cost of Revenue Comparison: Union Pacific Corporation vs United Rentals, Inc.