| __timestamp | CSX Corporation | Union Pacific Corporation |
|---|---|---|
| Wednesday, January 1, 2014 | 9056000000 | 14311000000 |
| Thursday, January 1, 2015 | 8227000000 | 12837000000 |
| Friday, January 1, 2016 | 7680000000 | 11672000000 |
| Sunday, January 1, 2017 | 7635000000 | 12231000000 |
| Monday, January 1, 2018 | 7477000000 | 13293000000 |
| Tuesday, January 1, 2019 | 7063000000 | 12094000000 |
| Wednesday, January 1, 2020 | 6221000000 | 10354000000 |
| Friday, January 1, 2021 | 7382000000 | 11290000000 |
| Saturday, January 1, 2022 | 9068000000 | 13670000000 |
| Sunday, January 1, 2023 | 9130000000 | 13590000000 |
| Monday, January 1, 2024 | 13211000000 |
Data in motion
In the competitive world of rail transportation, Union Pacific Corporation and CSX Corporation have long been industry titans. Over the past decade, their cost of revenue trends reveal intriguing insights into their operational efficiencies. From 2014 to 2023, Union Pacific consistently maintained a higher cost of revenue, peaking in 2014 at approximately 14.3 billion. However, by 2023, this figure had decreased by around 5%, reflecting strategic cost management. Meanwhile, CSX Corporation's cost of revenue saw a more volatile journey, starting at 9.1 billion in 2014, dipping to 6.2 billion in 2020, and rebounding to 9.1 billion by 2023. This 47% increase from its lowest point highlights CSX's resilience and adaptability. Notably, 2024 data for CSX is missing, leaving room for speculation on future trends. As these rail giants continue to evolve, their cost management strategies will be pivotal in shaping their competitive edge.

Union Pacific Corporation and CSX Corporation: A Comprehensive Revenue Analysis
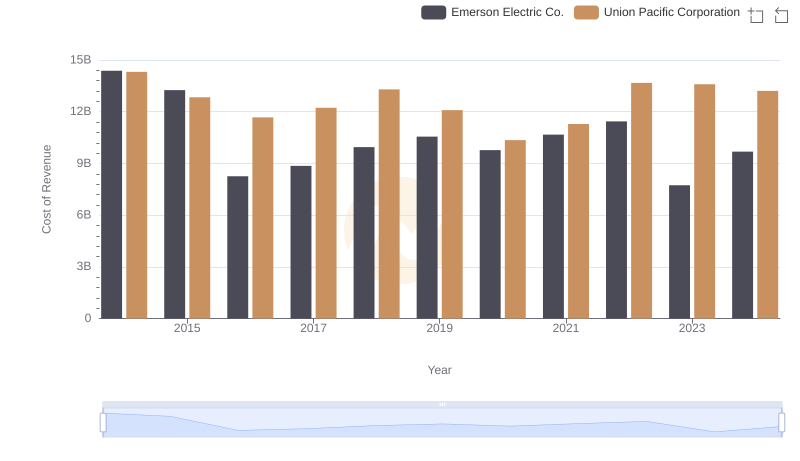
Cost of Revenue Trends: Union Pacific Corporation vs Emerson Electric Co.
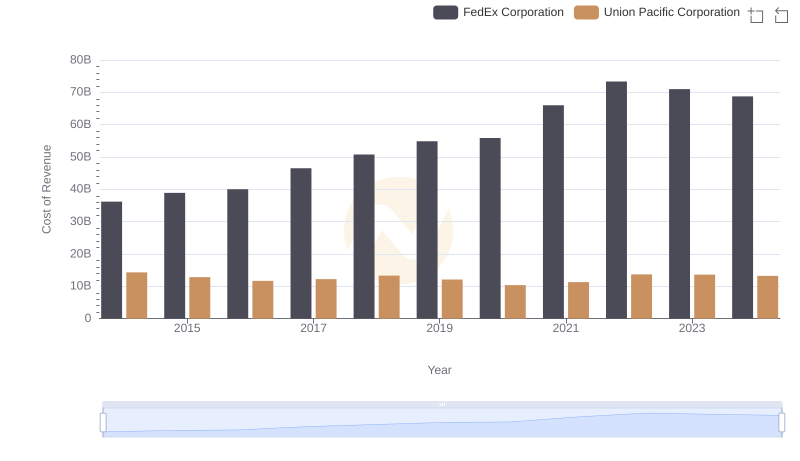
Union Pacific Corporation vs FedEx Corporation: Efficiency in Cost of Revenue Explored
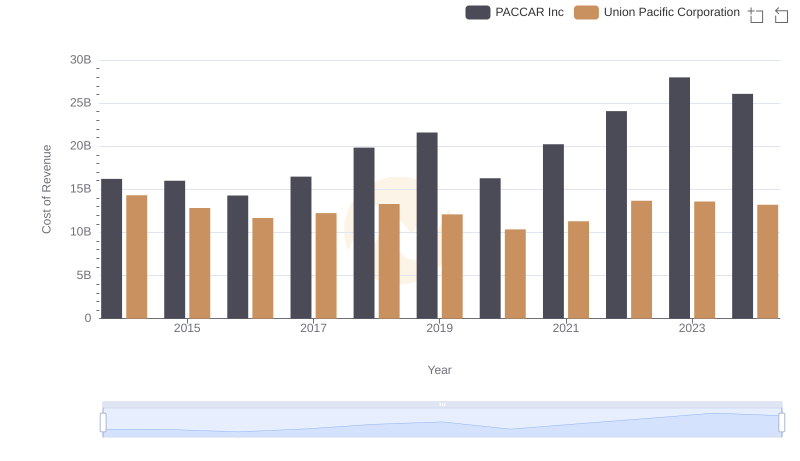
Analyzing Cost of Revenue: Union Pacific Corporation and PACCAR Inc
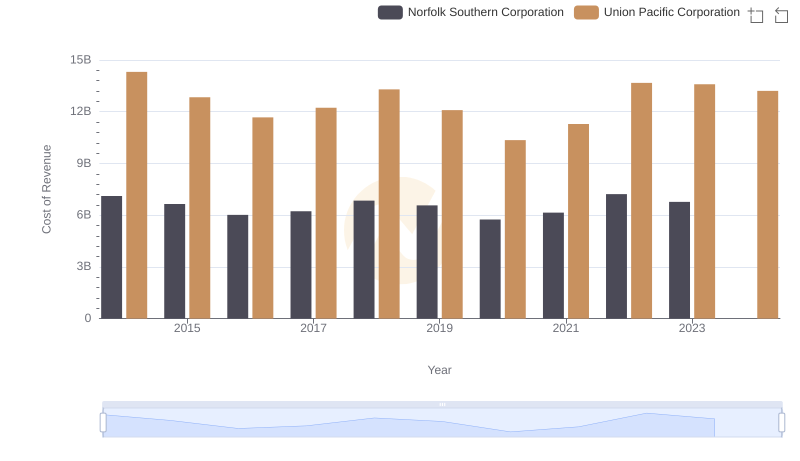
Cost Insights: Breaking Down Union Pacific Corporation and Norfolk Southern Corporation's Expenses
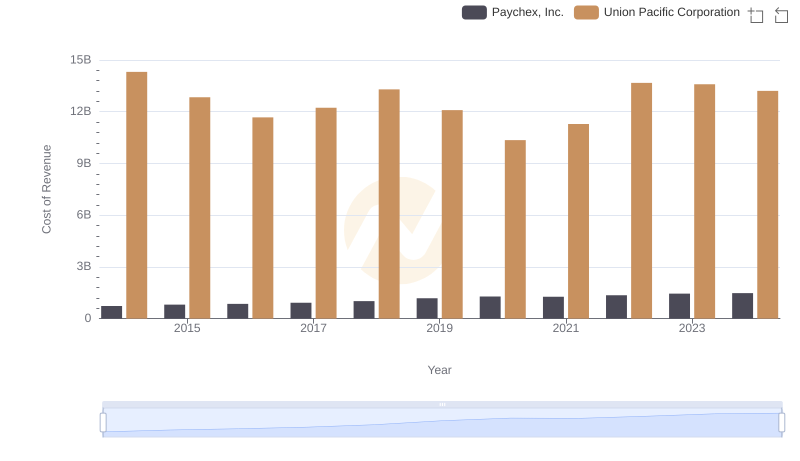
Analyzing Cost of Revenue: Union Pacific Corporation and Paychex, Inc.
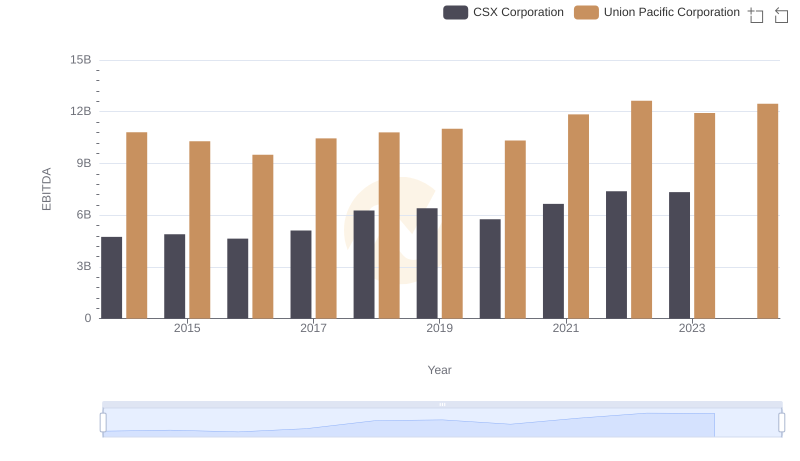
A Side-by-Side Analysis of EBITDA: Union Pacific Corporation and CSX Corporation