| __timestamp | Nordson Corporation | The Boeing Company |
|---|---|---|
| Wednesday, January 1, 2014 | 758923000 | 76752000000 |
| Thursday, January 1, 2015 | 774702000 | 82088000000 |
| Friday, January 1, 2016 | 815495000 | 80790000000 |
| Sunday, January 1, 2017 | 927981000 | 76066000000 |
| Monday, January 1, 2018 | 1018703000 | 81490000000 |
| Tuesday, January 1, 2019 | 1002123000 | 72093000000 |
| Wednesday, January 1, 2020 | 990632000 | 63843000000 |
| Friday, January 1, 2021 | 1038129000 | 59237000000 |
| Saturday, January 1, 2022 | 1163742000 | 63078000000 |
| Sunday, January 1, 2023 | 1203227000 | 70070000000 |
| Monday, January 1, 2024 | 1203792000 | 68508000000 |
Unveiling the hidden dimensions of data
In the ever-evolving landscape of aerospace and manufacturing, understanding cost dynamics is crucial. Over the past decade, The Boeing Company and Nordson Corporation have showcased contrasting trends in their cost of revenue. From 2014 to 2024, Boeing's cost of revenue has seen a decline of approximately 11%, reflecting the challenges faced by the aerospace giant, especially during the pandemic years. In contrast, Nordson Corporation, a leader in precision technology, has experienced a steady increase of around 58% in the same period, highlighting its growth trajectory and market adaptability.
These insights provide a window into the strategic maneuvers and market conditions influencing these industry leaders.
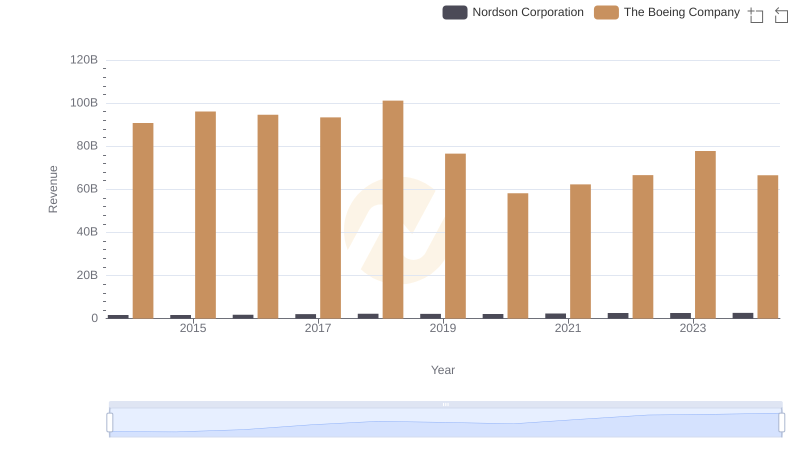
Revenue Insights: The Boeing Company and Nordson Corporation Performance Compared
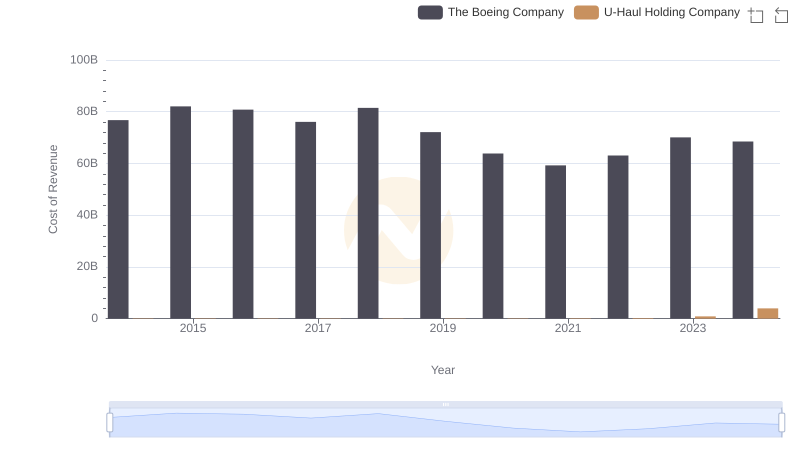
Cost of Revenue Comparison: The Boeing Company vs U-Haul Holding Company
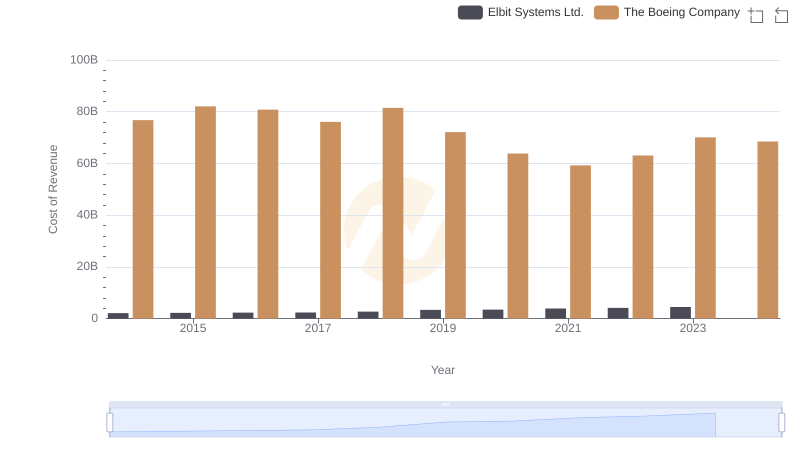
Cost Insights: Breaking Down The Boeing Company and Elbit Systems Ltd.'s Expenses
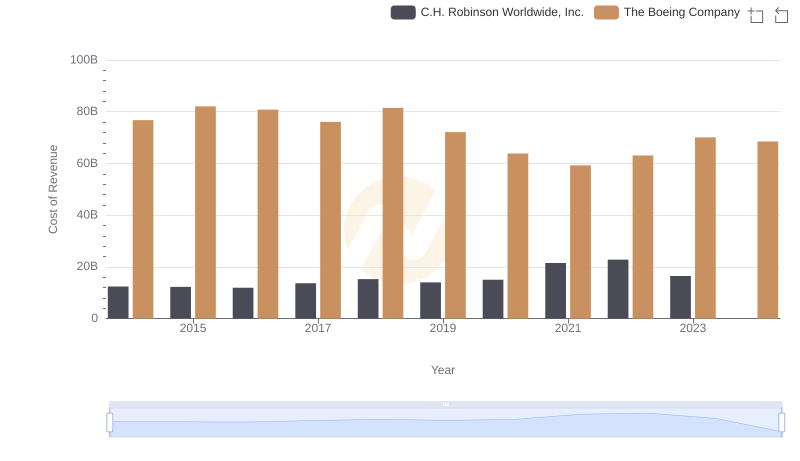
Cost Insights: Breaking Down The Boeing Company and C.H. Robinson Worldwide, Inc.'s Expenses
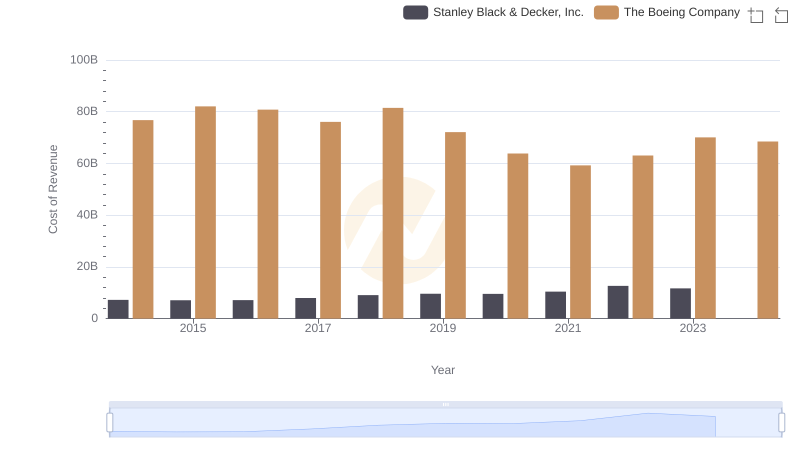
Cost of Revenue Comparison: The Boeing Company vs Stanley Black & Decker, Inc.
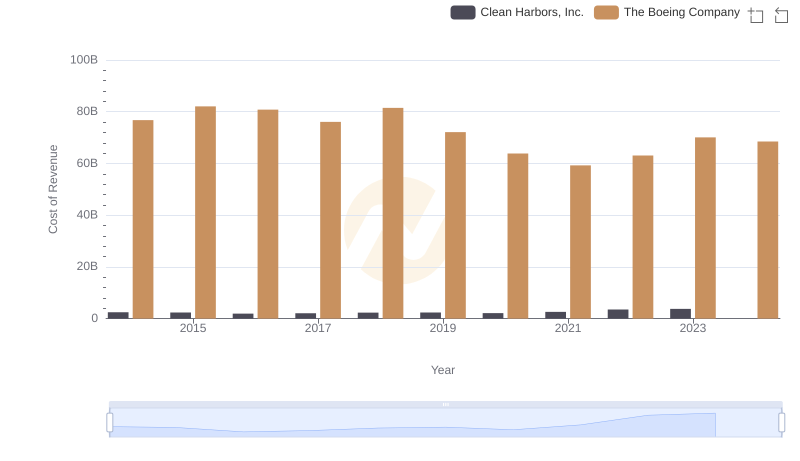
Cost of Revenue Comparison: The Boeing Company vs Clean Harbors, Inc.
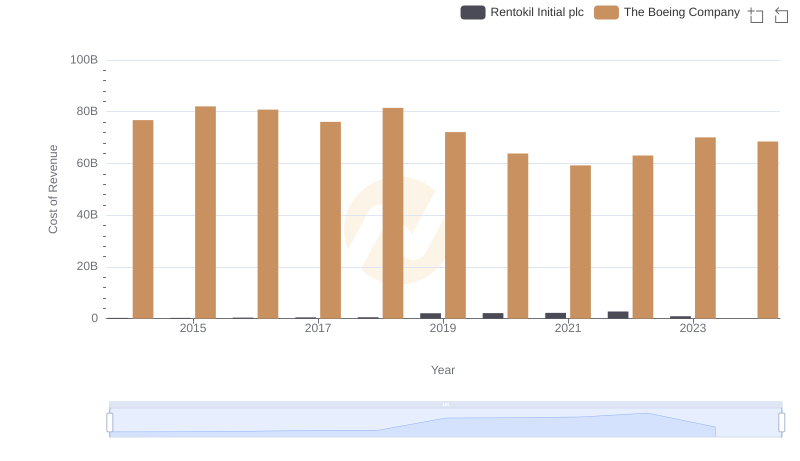
Comparing Cost of Revenue Efficiency: The Boeing Company vs Rentokil Initial plc
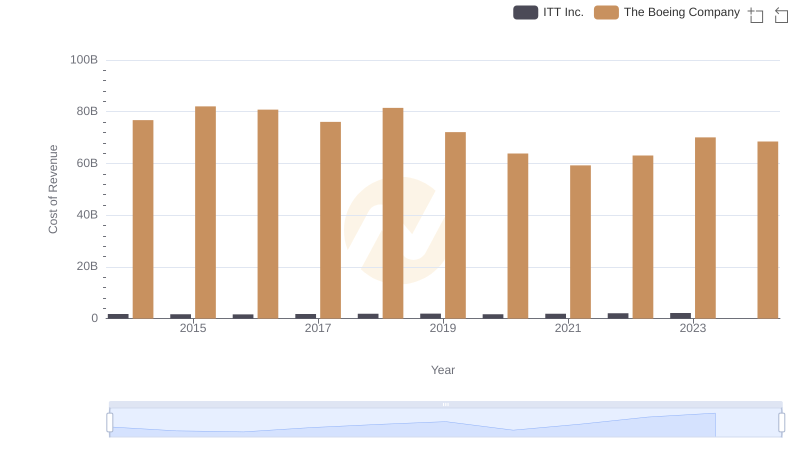
Cost of Revenue Trends: The Boeing Company vs ITT Inc.
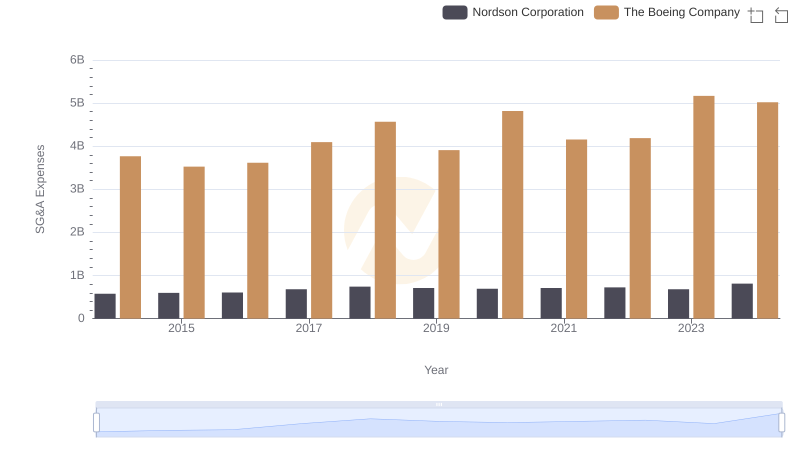
Operational Costs Compared: SG&A Analysis of The Boeing Company and Nordson Corporation
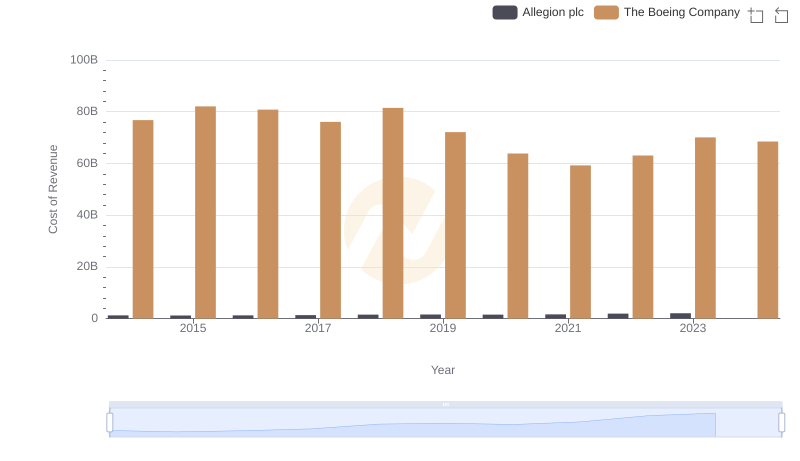
Analyzing Cost of Revenue: The Boeing Company and Allegion plc