| __timestamp | Nordson Corporation | The Boeing Company |
|---|---|---|
| Wednesday, January 1, 2014 | 1704021000 | 90762000000 |
| Thursday, January 1, 2015 | 1688666000 | 96114000000 |
| Friday, January 1, 2016 | 1808994000 | 94571000000 |
| Sunday, January 1, 2017 | 2066982000 | 93392000000 |
| Monday, January 1, 2018 | 2254668000 | 101127000000 |
| Tuesday, January 1, 2019 | 2194226000 | 76559000000 |
| Wednesday, January 1, 2020 | 2121100000 | 58158000000 |
| Friday, January 1, 2021 | 2362209000 | 62286000000 |
| Saturday, January 1, 2022 | 2590278000 | 66608000000 |
| Sunday, January 1, 2023 | 2628632000 | 77794000000 |
| Monday, January 1, 2024 | 2689921000 | 66517000000 |
Data in motion
In the past decade, The Boeing Company and Nordson Corporation have showcased contrasting revenue trajectories. Boeing, a titan in aerospace, saw its revenue peak in 2018, reaching approximately $101 billion, before experiencing a downturn, notably during the pandemic in 2020, with a 43% drop to around $58 billion. However, a recovery trend is evident, with revenues climbing back to nearly $78 billion by 2023.
Conversely, Nordson Corporation, a leader in precision technology, has demonstrated consistent growth. From 2014 to 2023, Nordson's revenue increased by about 58%, from $1.7 billion to $2.7 billion. This steady rise underscores Nordson's resilience and strategic market positioning.
These insights highlight the dynamic nature of the aerospace and technology sectors, reflecting broader economic shifts and company-specific strategies.
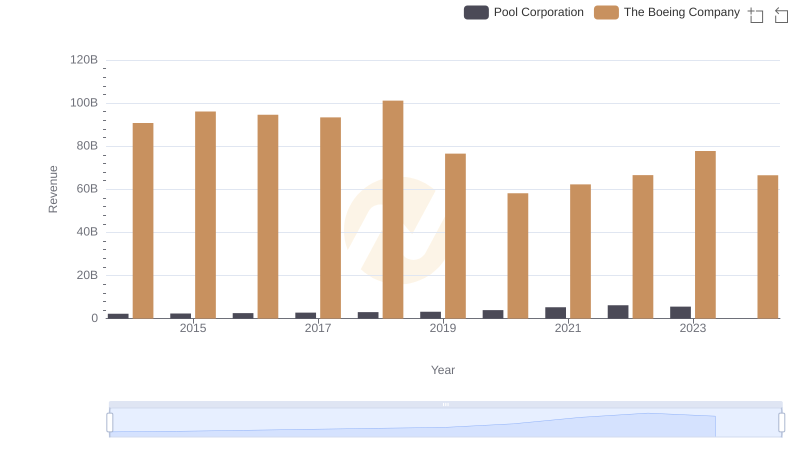
Breaking Down Revenue Trends: The Boeing Company vs Pool Corporation
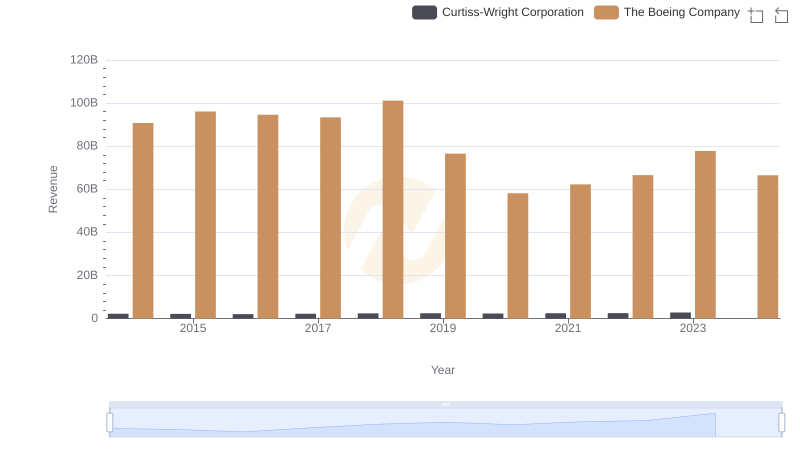
The Boeing Company and Curtiss-Wright Corporation: A Comprehensive Revenue Analysis
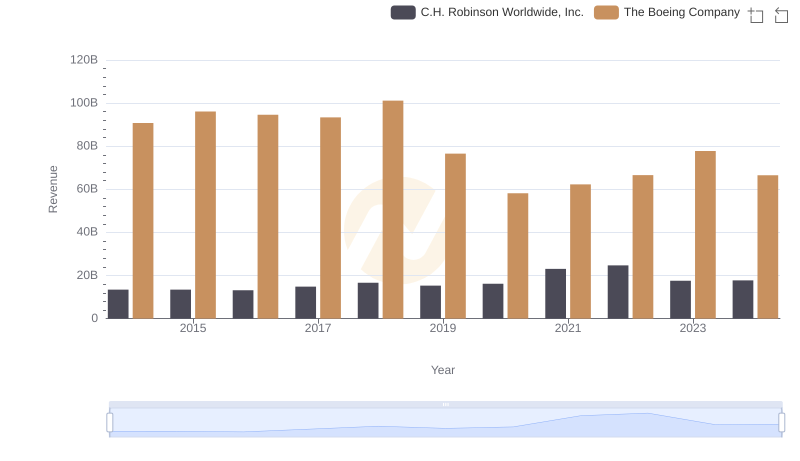
Revenue Insights: The Boeing Company and C.H. Robinson Worldwide, Inc. Performance Compared
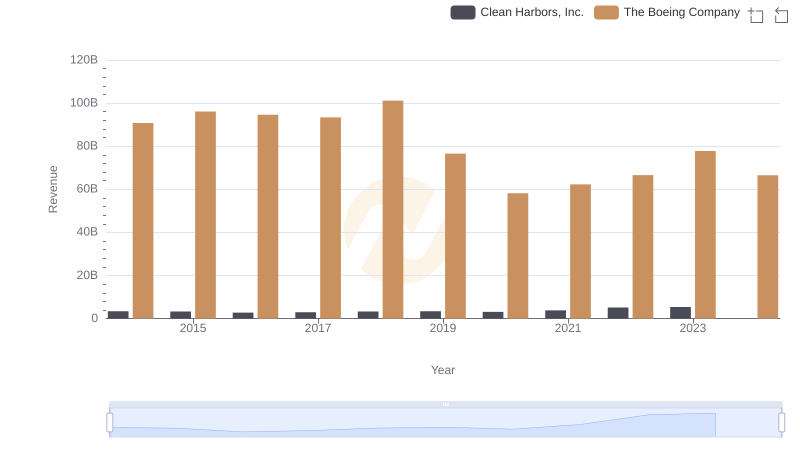
Comparing Revenue Performance: The Boeing Company or Clean Harbors, Inc.?
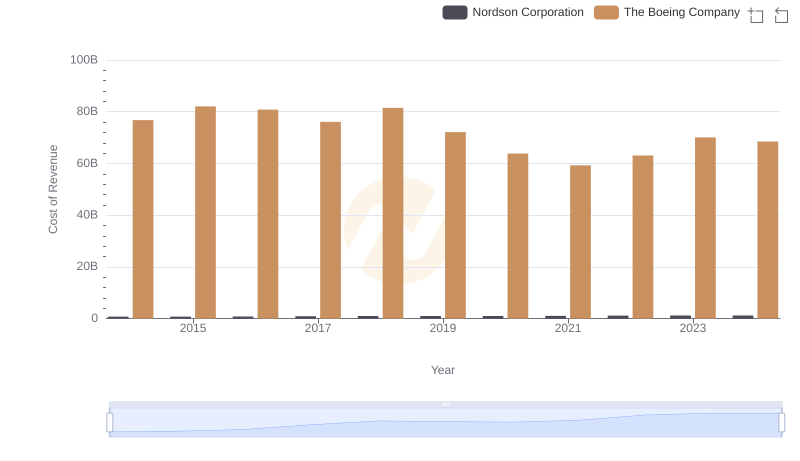
Analyzing Cost of Revenue: The Boeing Company and Nordson Corporation
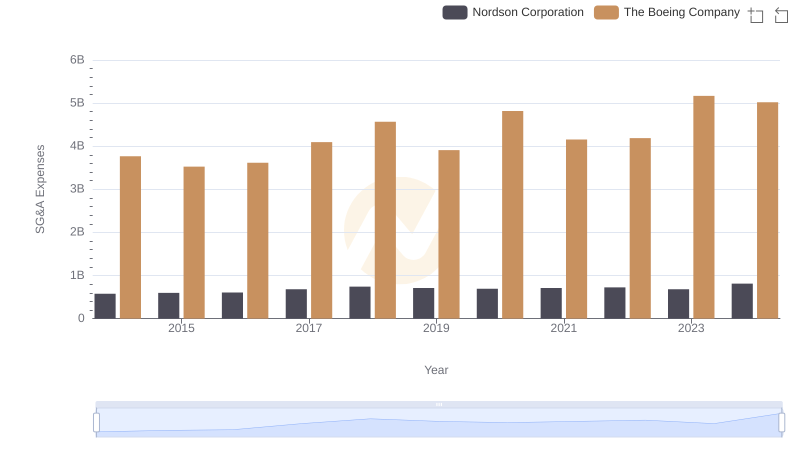
Operational Costs Compared: SG&A Analysis of The Boeing Company and Nordson Corporation