| __timestamp | ITT Inc. | The Boeing Company |
|---|---|---|
| Wednesday, January 1, 2014 | 1788200000 | 76752000000 |
| Thursday, January 1, 2015 | 1676500000 | 82088000000 |
| Friday, January 1, 2016 | 1647200000 | 80790000000 |
| Sunday, January 1, 2017 | 1768100000 | 76066000000 |
| Monday, January 1, 2018 | 1857900000 | 81490000000 |
| Tuesday, January 1, 2019 | 1936300000 | 72093000000 |
| Wednesday, January 1, 2020 | 1695600000 | 63843000000 |
| Friday, January 1, 2021 | 1865500000 | 59237000000 |
| Saturday, January 1, 2022 | 2065400000 | 63078000000 |
| Sunday, January 1, 2023 | 2175700000 | 70070000000 |
| Monday, January 1, 2024 | 2383400000 | 68508000000 |
Infusing magic into the data realm
In the ever-evolving aerospace and defense industry, understanding cost trends is crucial. From 2014 to 2023, The Boeing Company and ITT Inc. have shown distinct trajectories in their cost of revenue. Boeing, a titan in aerospace, saw its cost of revenue peak in 2015, with a gradual decline of approximately 17% by 2021. This reflects the industry's challenges, including production halts and global disruptions. Meanwhile, ITT Inc., a key player in engineering and manufacturing, experienced a steady increase, with costs rising by about 22% from 2014 to 2023. This growth underscores ITT's expanding operations and market reach. Notably, 2024 data for ITT is missing, hinting at potential shifts. These trends offer a window into the strategic maneuvers of these giants, highlighting resilience and adaptation in a competitive landscape.
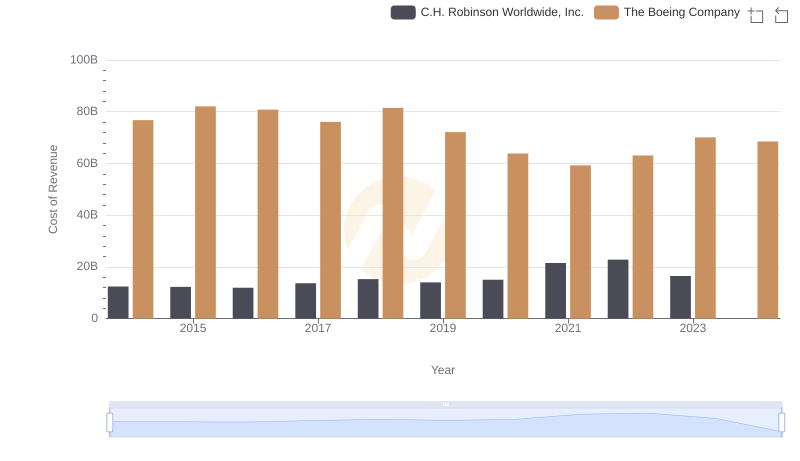
Cost Insights: Breaking Down The Boeing Company and C.H. Robinson Worldwide, Inc.'s Expenses
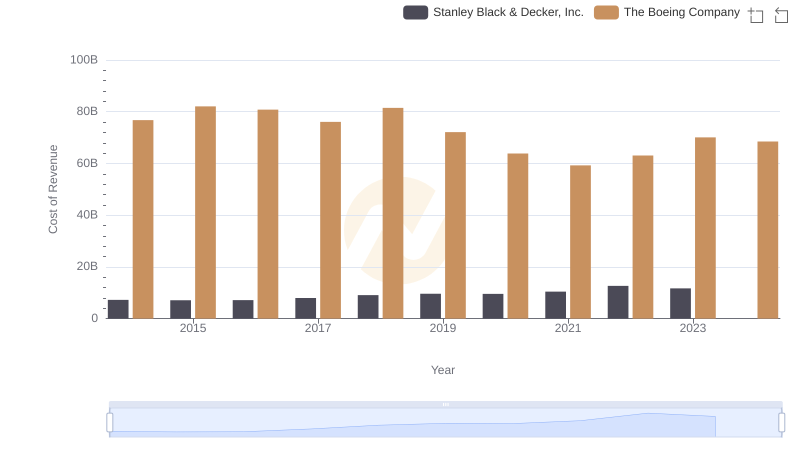
Cost of Revenue Comparison: The Boeing Company vs Stanley Black & Decker, Inc.
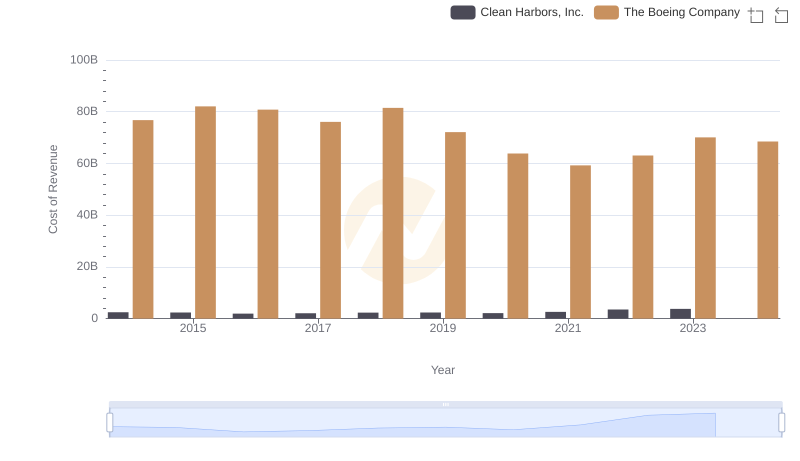
Cost of Revenue Comparison: The Boeing Company vs Clean Harbors, Inc.
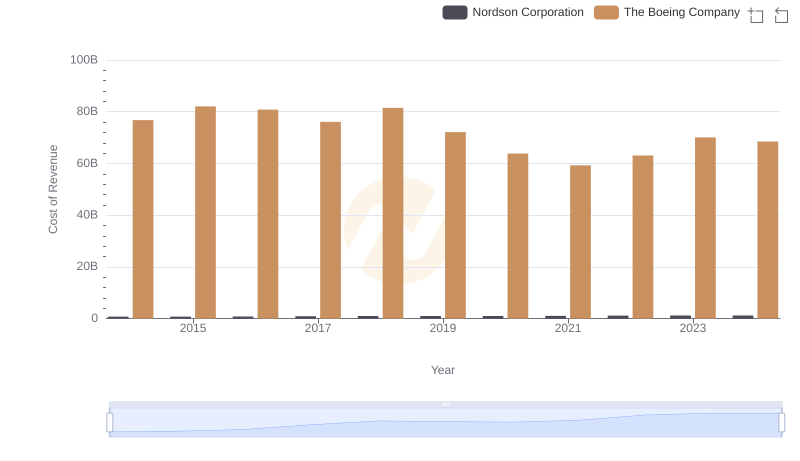
Analyzing Cost of Revenue: The Boeing Company and Nordson Corporation
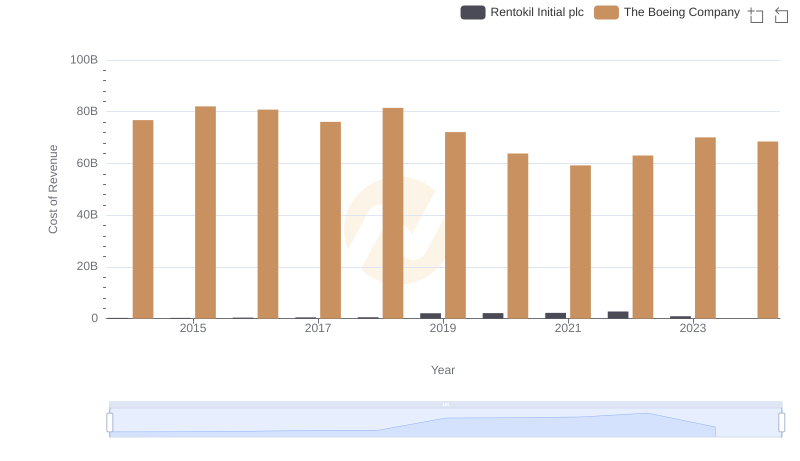
Comparing Cost of Revenue Efficiency: The Boeing Company vs Rentokil Initial plc
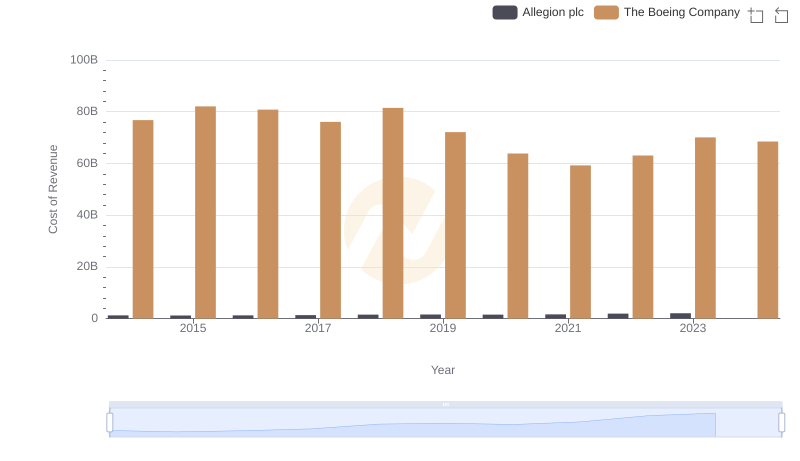
Analyzing Cost of Revenue: The Boeing Company and Allegion plc
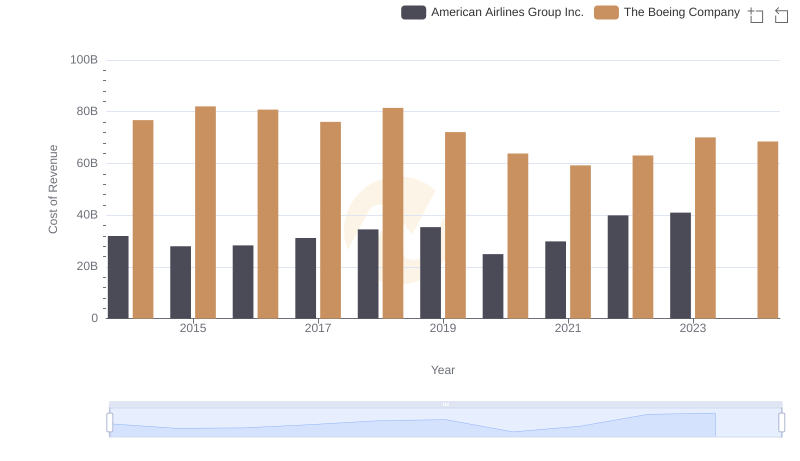
Cost of Revenue Trends: The Boeing Company vs American Airlines Group Inc.
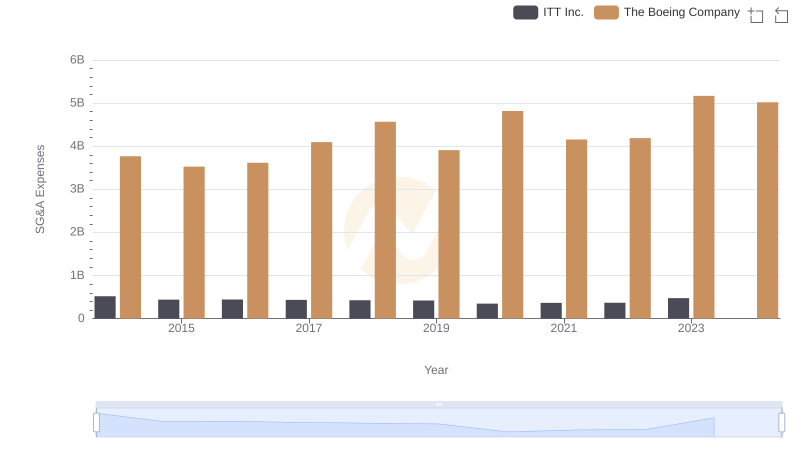
Who Optimizes SG&A Costs Better? The Boeing Company or ITT Inc.