| __timestamp | Clean Harbors, Inc. | The Boeing Company |
|---|---|---|
| Wednesday, January 1, 2014 | 2441796000 | 76752000000 |
| Thursday, January 1, 2015 | 2356806000 | 82088000000 |
| Friday, January 1, 2016 | 1932857000 | 80790000000 |
| Sunday, January 1, 2017 | 2062673000 | 76066000000 |
| Monday, January 1, 2018 | 2305551000 | 81490000000 |
| Tuesday, January 1, 2019 | 2387819000 | 72093000000 |
| Wednesday, January 1, 2020 | 2137751000 | 63843000000 |
| Friday, January 1, 2021 | 2609837000 | 59237000000 |
| Saturday, January 1, 2022 | 3543930000 | 63078000000 |
| Sunday, January 1, 2023 | 3746124000 | 70070000000 |
| Monday, January 1, 2024 | 4065713000 | 68508000000 |
Cracking the code
In the ever-evolving landscape of aerospace and environmental services, The Boeing Company and Clean Harbors, Inc. stand as titans in their respective fields. Over the past decade, from 2014 to 2023, these companies have showcased contrasting trajectories in their cost of revenue.
Boeing, a leader in aerospace, has seen its cost of revenue fluctuate significantly. From a peak in 2015, the cost dipped by approximately 28% by 2021, reflecting the industry's challenges, including the global pandemic's impact on air travel.
Conversely, Clean Harbors, a key player in environmental services, has experienced a steady increase in its cost of revenue, growing by nearly 54% from 2014 to 2023. This rise underscores the growing demand for environmental solutions.
While Boeing's data for 2024 remains incomplete, the trends highlight the dynamic nature of these industries.
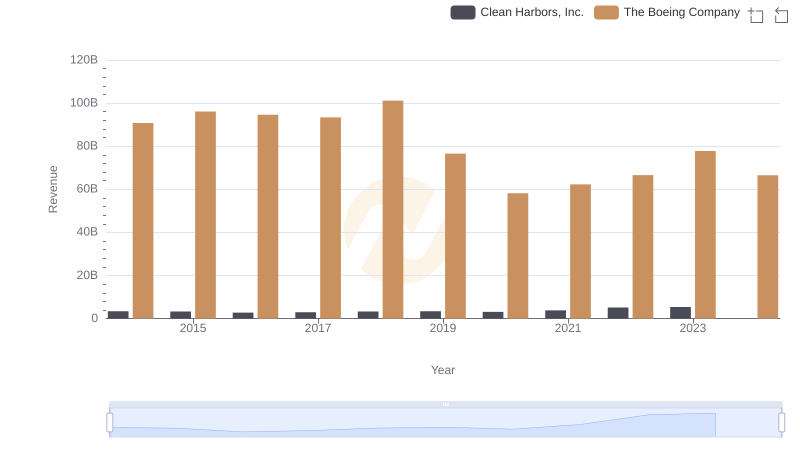
Comparing Revenue Performance: The Boeing Company or Clean Harbors, Inc.?
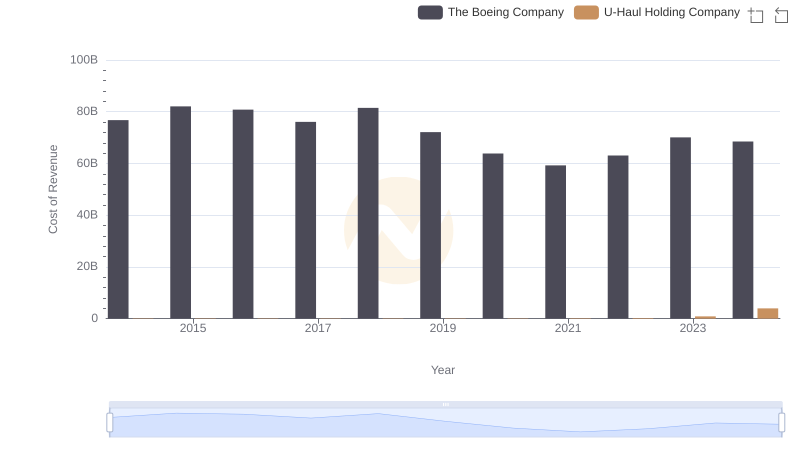
Cost of Revenue Comparison: The Boeing Company vs U-Haul Holding Company
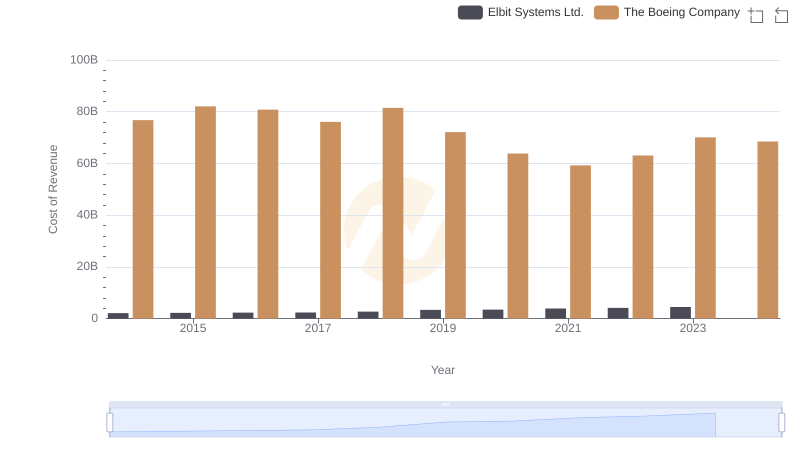
Cost Insights: Breaking Down The Boeing Company and Elbit Systems Ltd.'s Expenses
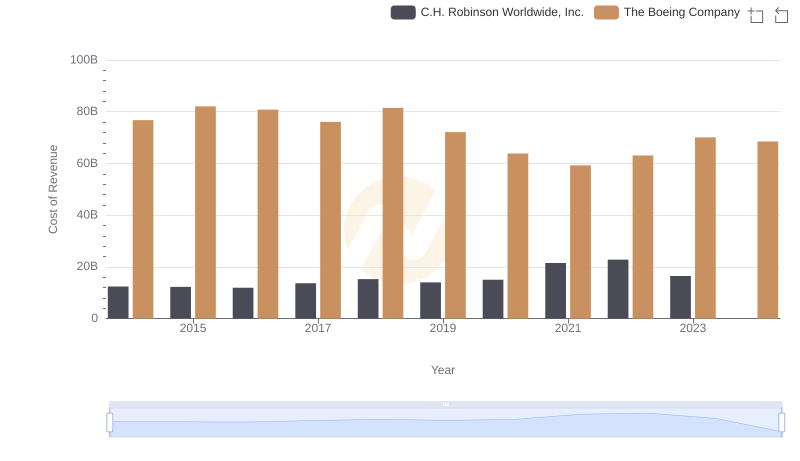
Cost Insights: Breaking Down The Boeing Company and C.H. Robinson Worldwide, Inc.'s Expenses
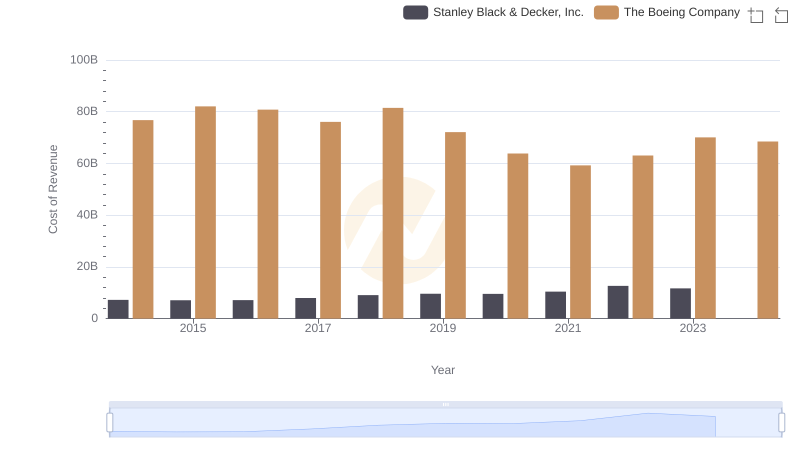
Cost of Revenue Comparison: The Boeing Company vs Stanley Black & Decker, Inc.
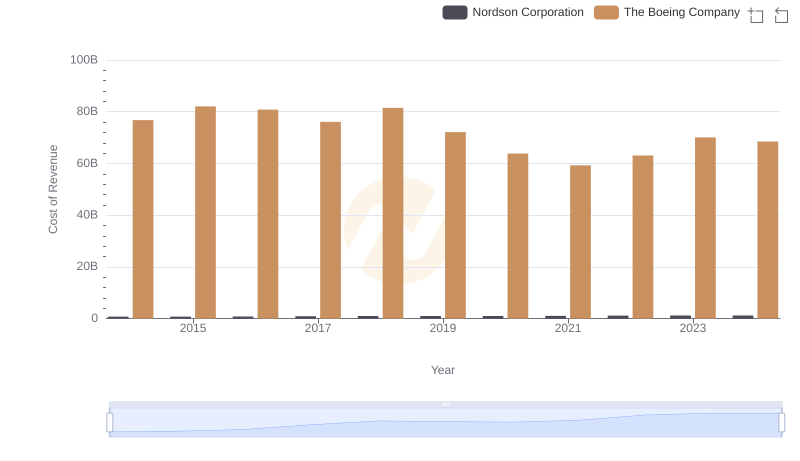
Analyzing Cost of Revenue: The Boeing Company and Nordson Corporation
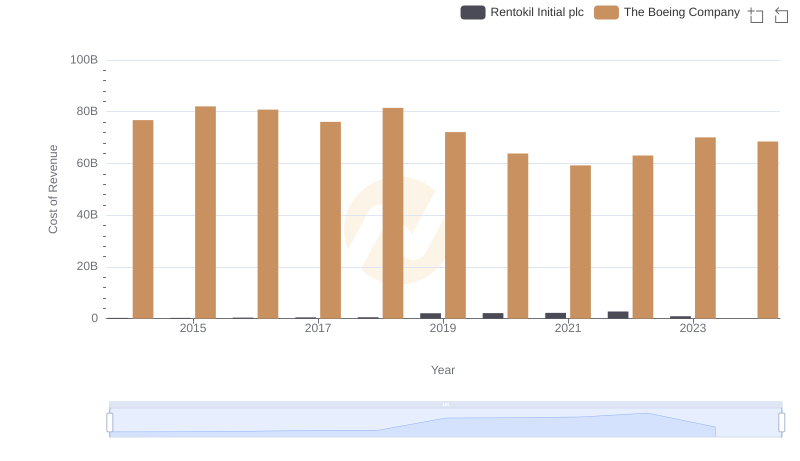
Comparing Cost of Revenue Efficiency: The Boeing Company vs Rentokil Initial plc