| __timestamp | Allegion plc | The Boeing Company |
|---|---|---|
| Wednesday, January 1, 2014 | 1264600000 | 76752000000 |
| Thursday, January 1, 2015 | 1199000000 | 82088000000 |
| Friday, January 1, 2016 | 1252700000 | 80790000000 |
| Sunday, January 1, 2017 | 1337500000 | 76066000000 |
| Monday, January 1, 2018 | 1558400000 | 81490000000 |
| Tuesday, January 1, 2019 | 1601700000 | 72093000000 |
| Wednesday, January 1, 2020 | 1541100000 | 63843000000 |
| Friday, January 1, 2021 | 1662500000 | 59237000000 |
| Saturday, January 1, 2022 | 1949500000 | 63078000000 |
| Sunday, January 1, 2023 | 2069300000 | 70070000000 |
| Monday, January 1, 2024 | 2103700000 | 68508000000 |
Igniting the spark of knowledge
In the ever-evolving aerospace and security industries, understanding cost dynamics is crucial. From 2014 to 2023, The Boeing Company and Allegion plc have shown contrasting trends in their cost of revenue. Boeing, a giant in aerospace, saw its cost of revenue peak in 2015, with a gradual decline of approximately 14% by 2021. This reflects the challenges faced by the aviation sector, including economic downturns and global disruptions.
Conversely, Allegion, a leader in security solutions, experienced a steady increase in costs, rising by about 73% over the same period. This growth aligns with the increasing demand for security products worldwide. Notably, 2023 marked a significant year for Allegion, with costs reaching their highest point, while Boeing showed signs of recovery. Missing data for 2024 suggests ongoing fluctuations, emphasizing the need for strategic cost management in these industries.
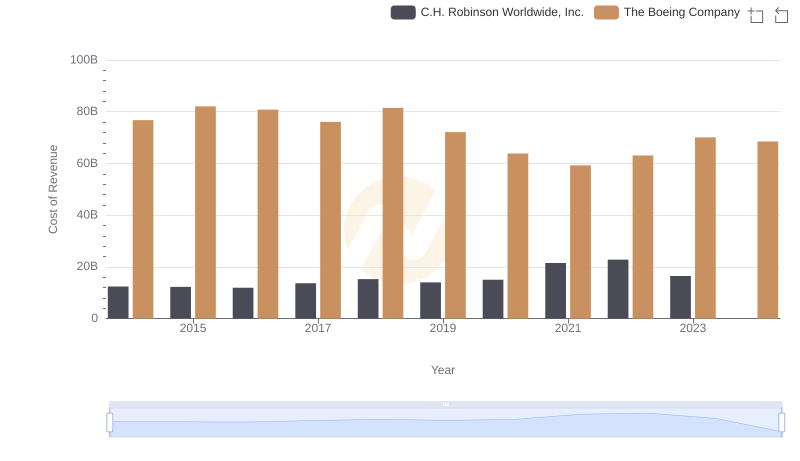
Cost Insights: Breaking Down The Boeing Company and C.H. Robinson Worldwide, Inc.'s Expenses
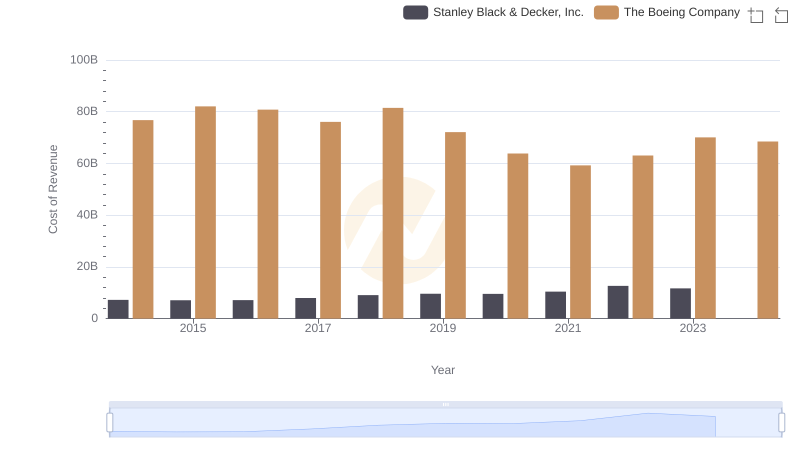
Cost of Revenue Comparison: The Boeing Company vs Stanley Black & Decker, Inc.
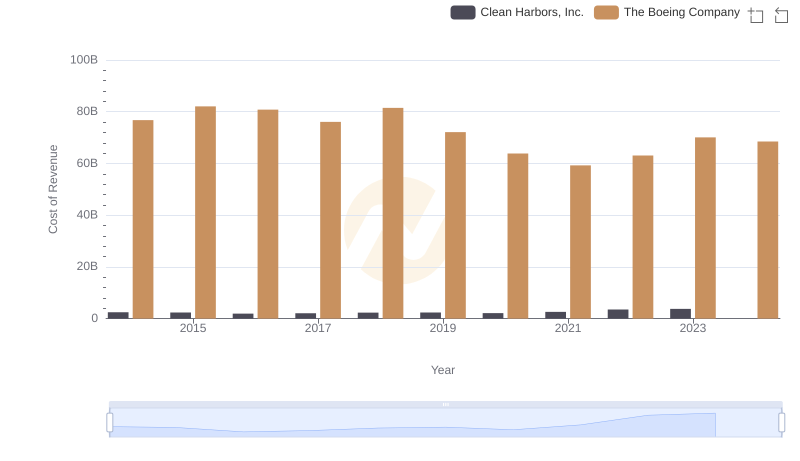
Cost of Revenue Comparison: The Boeing Company vs Clean Harbors, Inc.
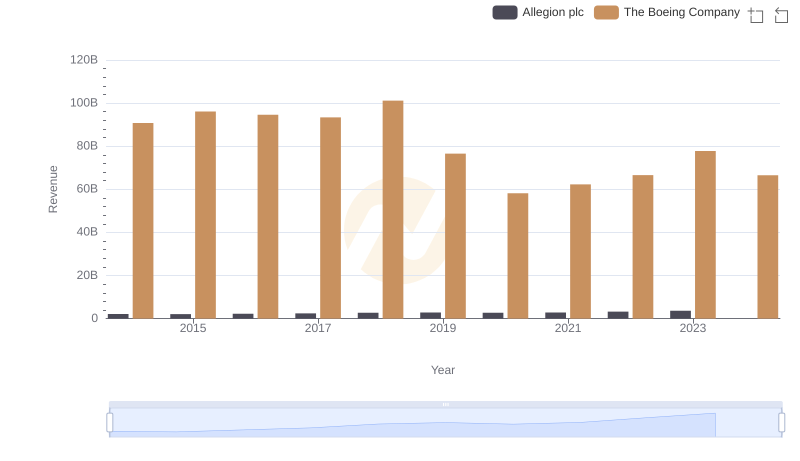
Revenue Showdown: The Boeing Company vs Allegion plc
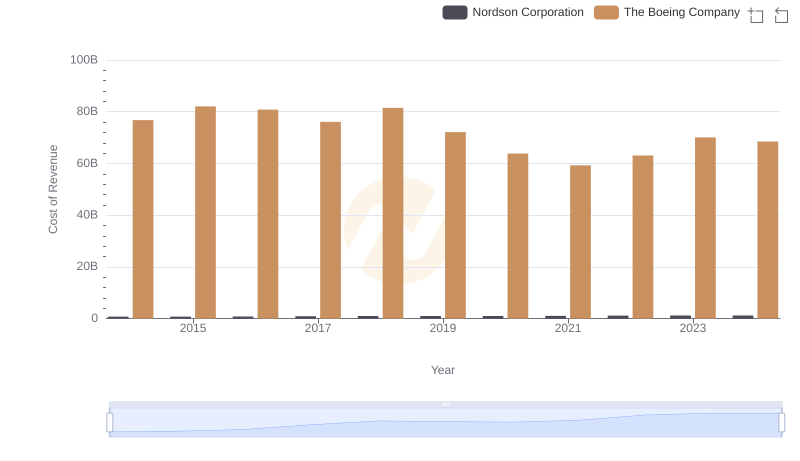
Analyzing Cost of Revenue: The Boeing Company and Nordson Corporation
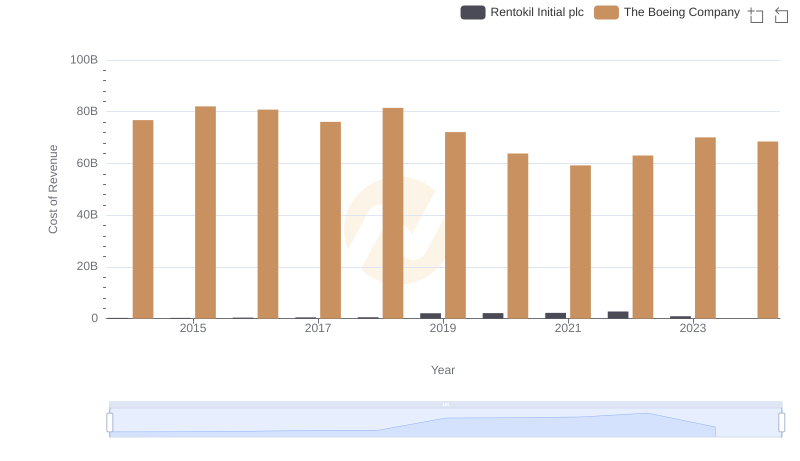
Comparing Cost of Revenue Efficiency: The Boeing Company vs Rentokil Initial plc
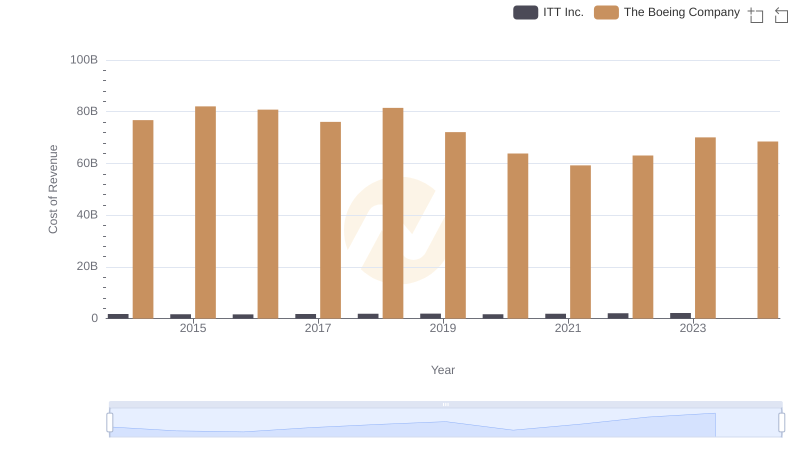
Cost of Revenue Trends: The Boeing Company vs ITT Inc.
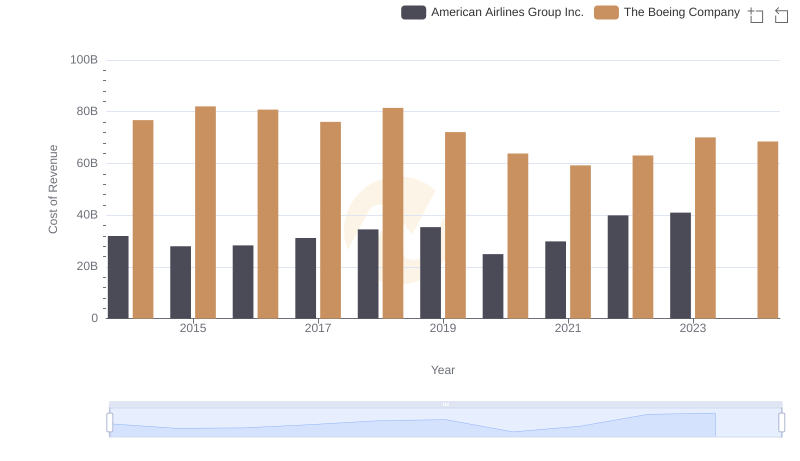
Cost of Revenue Trends: The Boeing Company vs American Airlines Group Inc.
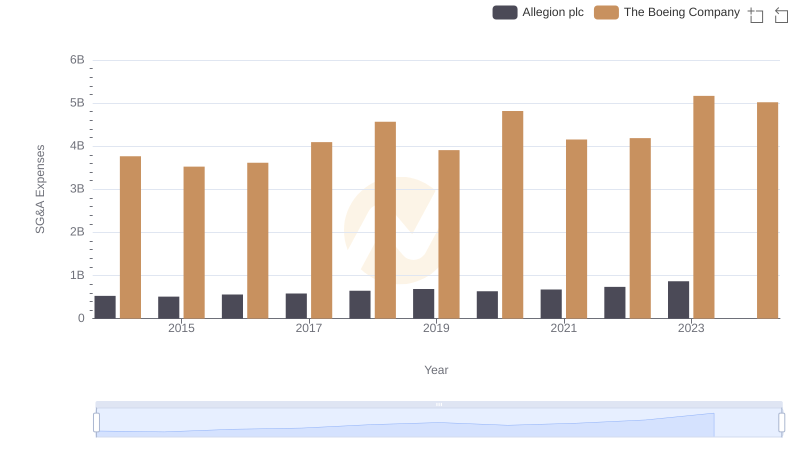
The Boeing Company and Allegion plc: SG&A Spending Patterns Compared