| __timestamp | Stanley Black & Decker, Inc. | The Boeing Company |
|---|---|---|
| Wednesday, January 1, 2014 | 7235900000 | 76752000000 |
| Thursday, January 1, 2015 | 7099800000 | 82088000000 |
| Friday, January 1, 2016 | 7139700000 | 80790000000 |
| Sunday, January 1, 2017 | 7969200000 | 76066000000 |
| Monday, January 1, 2018 | 9080500000 | 81490000000 |
| Tuesday, January 1, 2019 | 9636700000 | 72093000000 |
| Wednesday, January 1, 2020 | 9566700000 | 63843000000 |
| Friday, January 1, 2021 | 10423000000 | 59237000000 |
| Saturday, January 1, 2022 | 12663300000 | 63078000000 |
| Sunday, January 1, 2023 | 11683100000 | 70070000000 |
| Monday, January 1, 2024 | 10851300000 | 68508000000 |
Cracking the code
In the world of industrial titans, The Boeing Company and Stanley Black & Decker, Inc. stand as paragons of their respective fields. Over the past decade, from 2014 to 2023, these companies have showcased contrasting trajectories in their cost of revenue. Boeing, a leader in aerospace, saw its cost of revenue peak in 2015, with a gradual decline of approximately 17% by 2023. This trend reflects the challenges faced by the aviation industry, including global economic shifts and technological advancements.
Conversely, Stanley Black & Decker, a stalwart in tools and storage, experienced a steady rise in its cost of revenue, culminating in a 62% increase by 2023. This growth underscores the company's resilience and adaptability in a competitive market. Notably, data for 2024 remains incomplete, leaving room for speculation on future trends. As these giants continue to evolve, their financial narratives offer valuable insights into the broader industrial landscape.
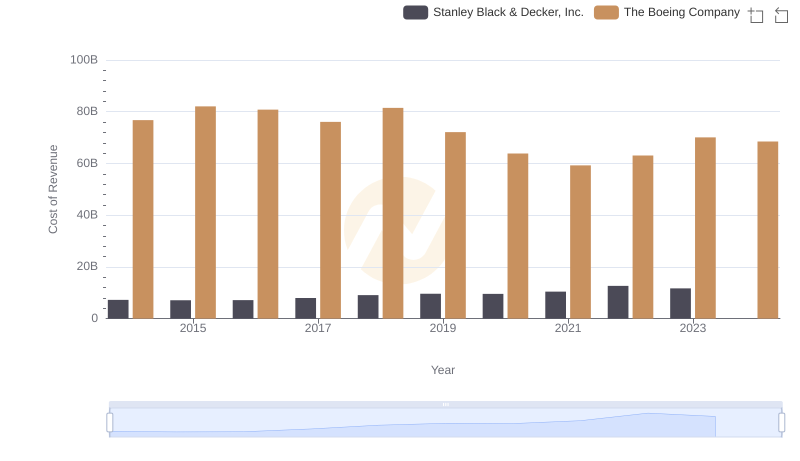
Comparing Cost of Revenue Efficiency: The Boeing Company vs Stanley Black & Decker, Inc.
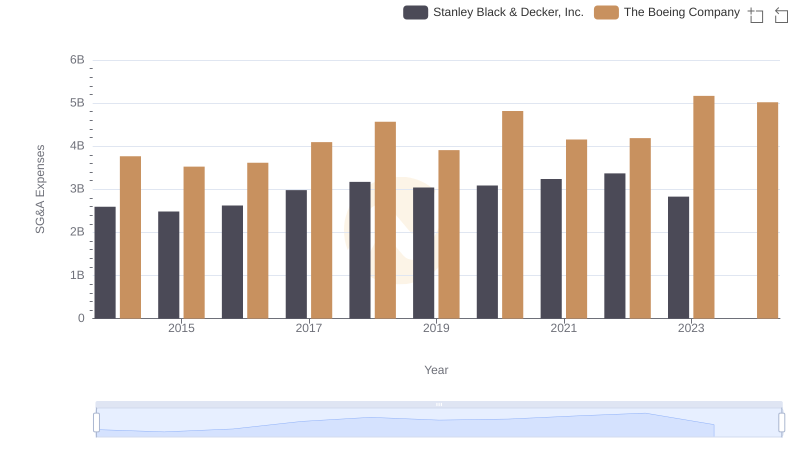
Selling, General, and Administrative Costs: The Boeing Company vs Stanley Black & Decker, Inc.
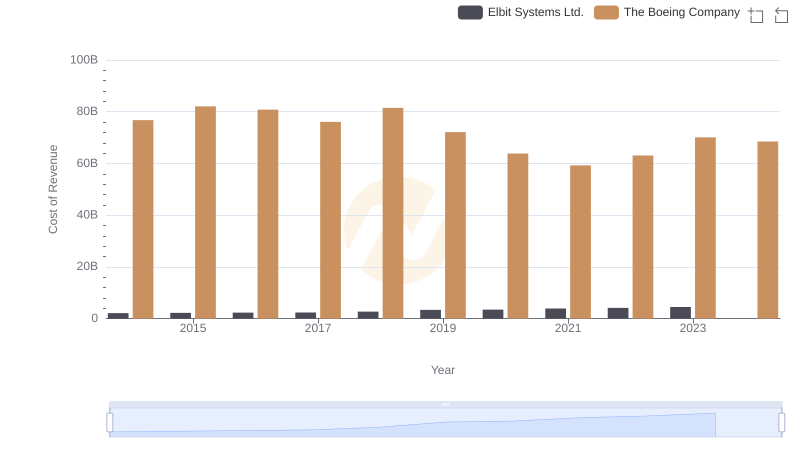
Cost Insights: Breaking Down The Boeing Company and Elbit Systems Ltd.'s Expenses
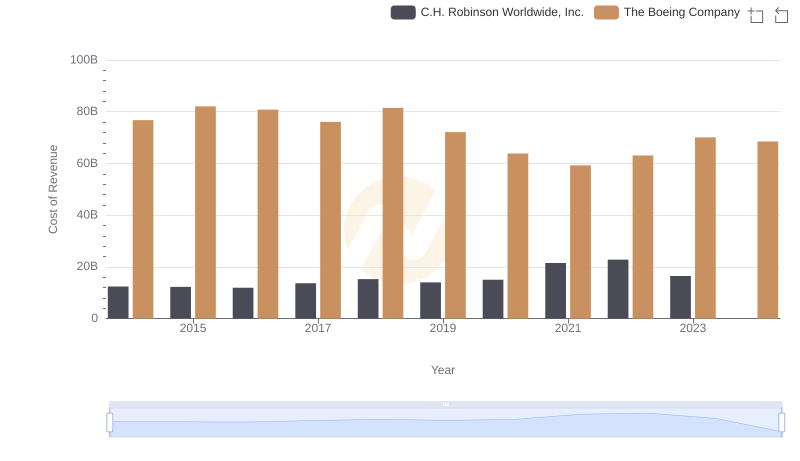
Cost Insights: Breaking Down The Boeing Company and C.H. Robinson Worldwide, Inc.'s Expenses
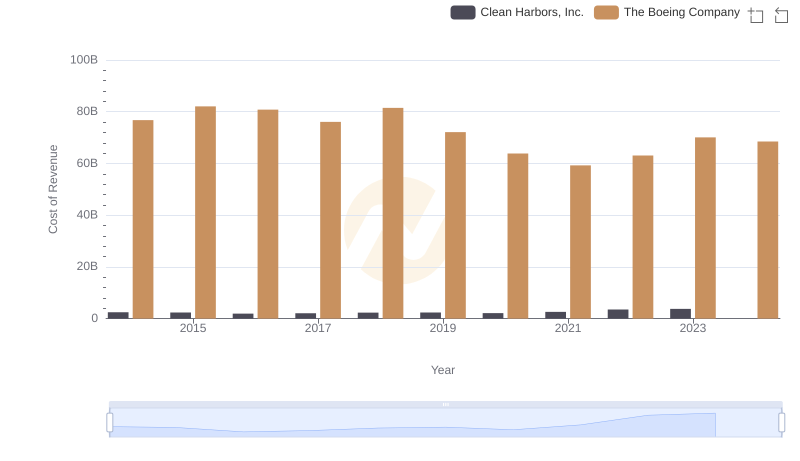
Cost of Revenue Comparison: The Boeing Company vs Clean Harbors, Inc.
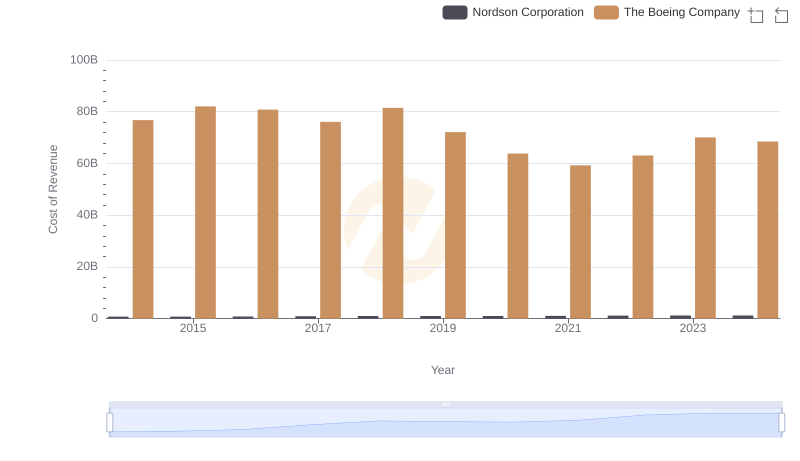
Analyzing Cost of Revenue: The Boeing Company and Nordson Corporation
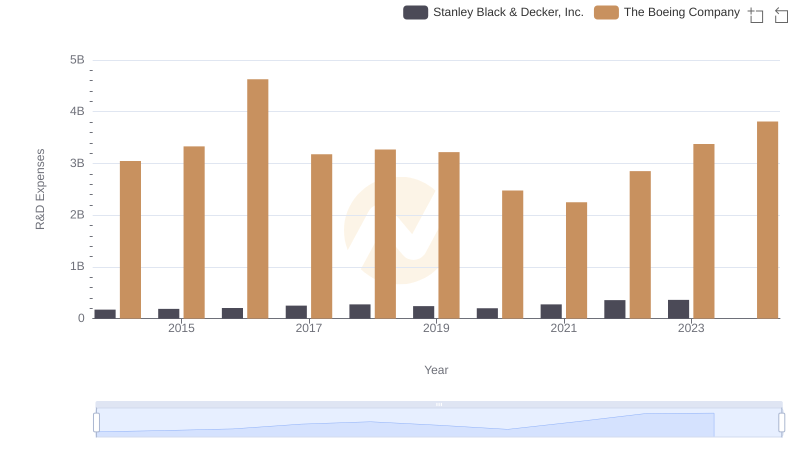
R&D Spending Showdown: The Boeing Company vs Stanley Black & Decker, Inc.

The Boeing Company or Stanley Black & Decker, Inc.: Who Manages SG&A Costs Better?