| __timestamp | C.H. Robinson Worldwide, Inc. | The Boeing Company |
|---|---|---|
| Wednesday, January 1, 2014 | 12401436000 | 76752000000 |
| Thursday, January 1, 2015 | 12259014000 | 82088000000 |
| Friday, January 1, 2016 | 11931821000 | 80790000000 |
| Sunday, January 1, 2017 | 13680857000 | 76066000000 |
| Monday, January 1, 2018 | 15269479000 | 81490000000 |
| Tuesday, January 1, 2019 | 14021726000 | 72093000000 |
| Wednesday, January 1, 2020 | 15037716000 | 63843000000 |
| Friday, January 1, 2021 | 21493659000 | 59237000000 |
| Saturday, January 1, 2022 | 22826428000 | 63078000000 |
| Sunday, January 1, 2023 | 16457570000 | 70070000000 |
| Monday, January 1, 2024 | 16416191000 | 68508000000 |
Unleashing insights
In the ever-evolving landscape of global commerce, understanding cost dynamics is crucial. This analysis delves into the cost of revenue trends for two industry giants: The Boeing Company and C.H. Robinson Worldwide, Inc., from 2014 to 2023.
Boeing, a leader in aerospace, saw its cost of revenue peak in 2015, with a gradual decline thereafter. By 2023, costs had decreased by approximately 15% from their 2015 high, reflecting strategic cost management amidst industry challenges.
C.H. Robinson, a logistics powerhouse, experienced a significant cost surge in 2021, marking a 50% increase from 2014. This spike aligns with global supply chain disruptions, highlighting the company's adaptive strategies.
Notably, 2024 data for C.H. Robinson is absent, suggesting potential reporting delays or strategic shifts. This gap invites speculation on future cost strategies.
Explore these insights to understand how these companies navigate financial landscapes.
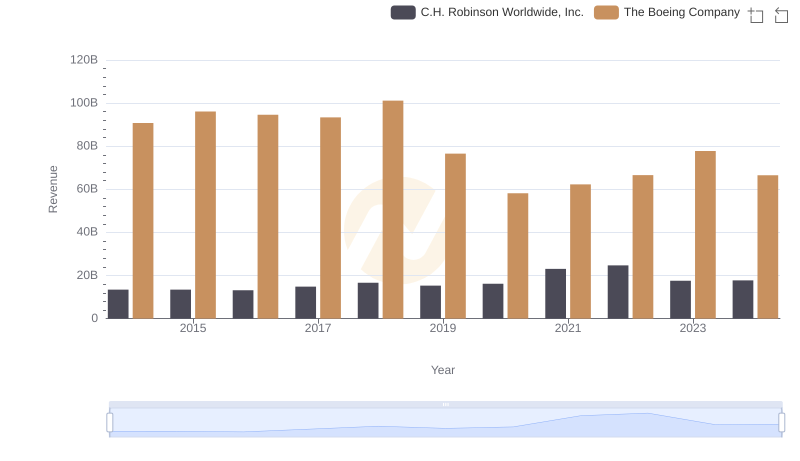
Revenue Insights: The Boeing Company and C.H. Robinson Worldwide, Inc. Performance Compared
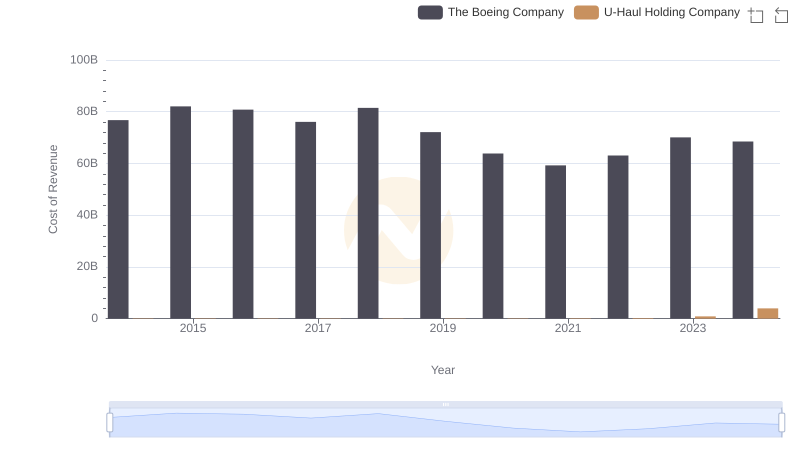
Cost of Revenue Comparison: The Boeing Company vs U-Haul Holding Company
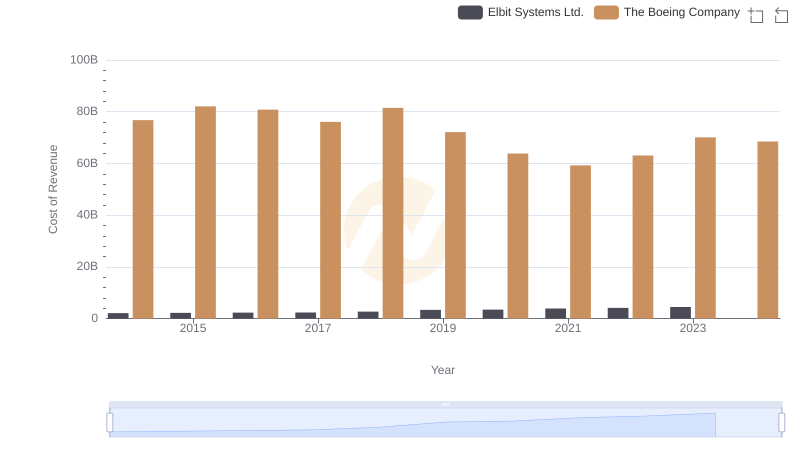
Cost Insights: Breaking Down The Boeing Company and Elbit Systems Ltd.'s Expenses
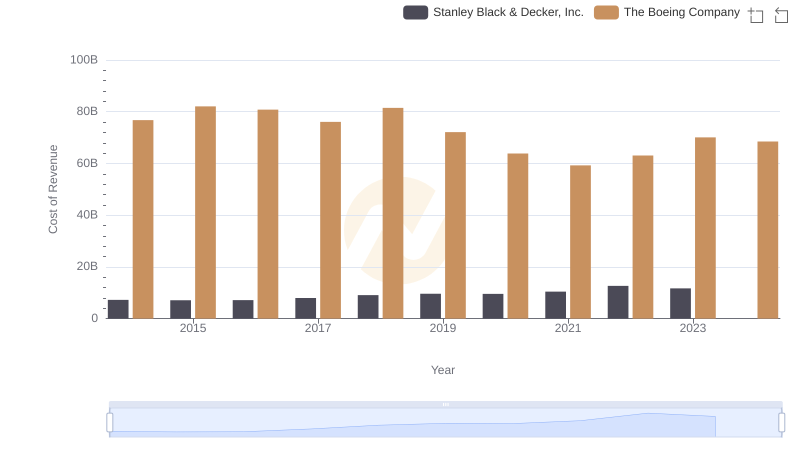
Cost of Revenue Comparison: The Boeing Company vs Stanley Black & Decker, Inc.
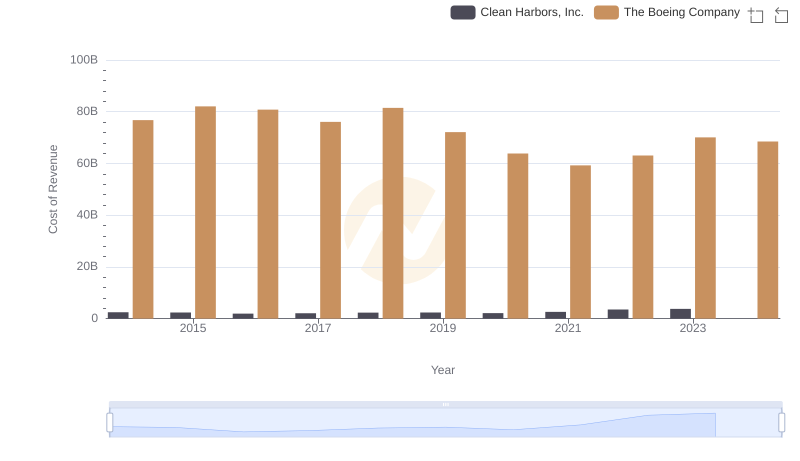
Cost of Revenue Comparison: The Boeing Company vs Clean Harbors, Inc.
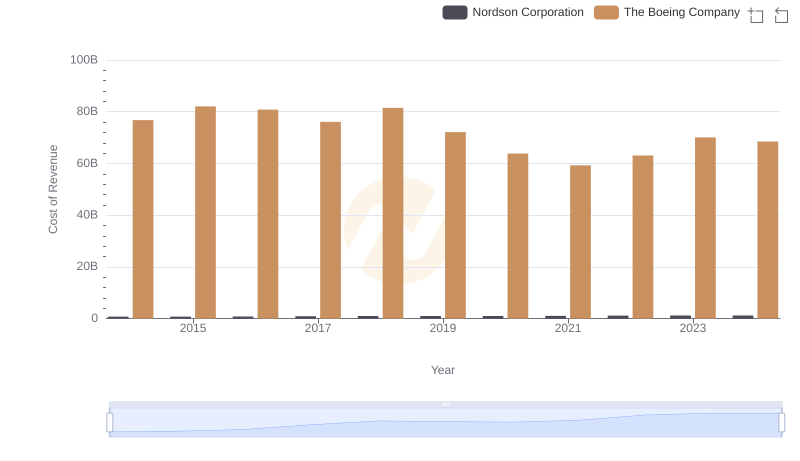
Analyzing Cost of Revenue: The Boeing Company and Nordson Corporation
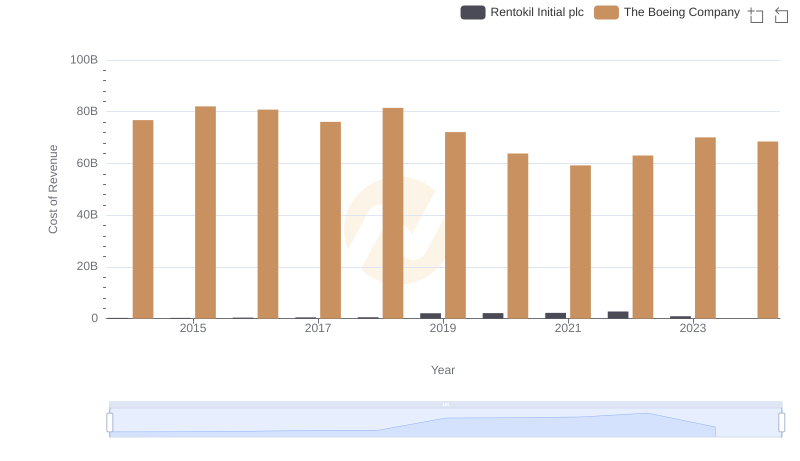
Comparing Cost of Revenue Efficiency: The Boeing Company vs Rentokil Initial plc