| __timestamp | Nordson Corporation | The Boeing Company |
|---|---|---|
| Wednesday, January 1, 2014 | 577993000 | 3767000000 |
| Thursday, January 1, 2015 | 596234000 | 3525000000 |
| Friday, January 1, 2016 | 605068000 | 3616000000 |
| Sunday, January 1, 2017 | 681299000 | 4094000000 |
| Monday, January 1, 2018 | 741408000 | 4567000000 |
| Tuesday, January 1, 2019 | 708990000 | 3909000000 |
| Wednesday, January 1, 2020 | 693552000 | 4817000000 |
| Friday, January 1, 2021 | 708953000 | 4157000000 |
| Saturday, January 1, 2022 | 724176000 | 4187000000 |
| Sunday, January 1, 2023 | 681244000 | 5168000000 |
| Monday, January 1, 2024 | 812128000 | 5021000000 |
Cracking the code
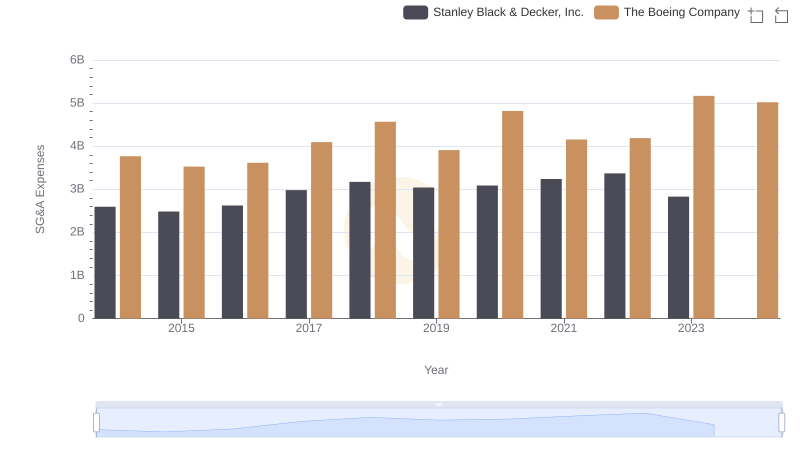
In the world of corporate finance, Selling, General, and Administrative (SG&A) expenses are a critical measure of operational efficiency. This analysis compares the SG&A expenses of The Boeing Company and Nordson Corporation from 2014 to 2024. Over this decade, Boeing's SG&A expenses have consistently been higher, reflecting its vast scale in the aerospace industry. In 2023, Boeing's expenses peaked at approximately 5.2 billion, a 37% increase from 2014. Meanwhile, Nordson, a leader in precision technology, saw a 40% rise in SG&A expenses, reaching around 812 million in 2024. This growth underscores Nordson's strategic investments in innovation and market expansion. The data reveals how these industry leaders manage operational costs amidst evolving market dynamics, offering insights into their financial strategies and resilience.
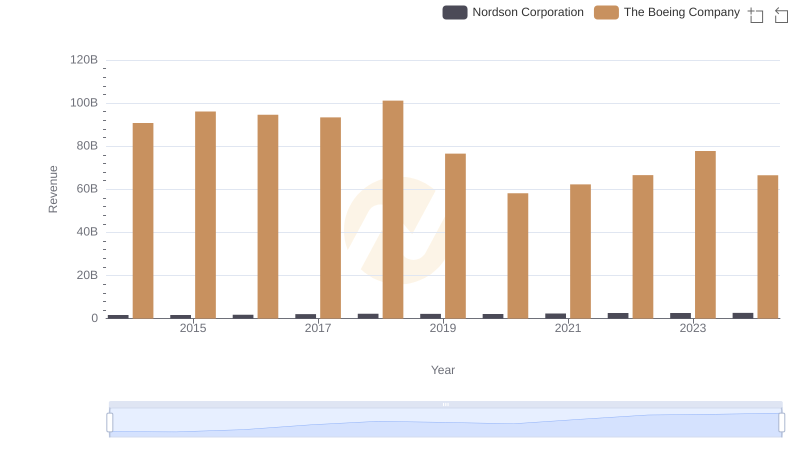
Revenue Insights: The Boeing Company and Nordson Corporation Performance Compared
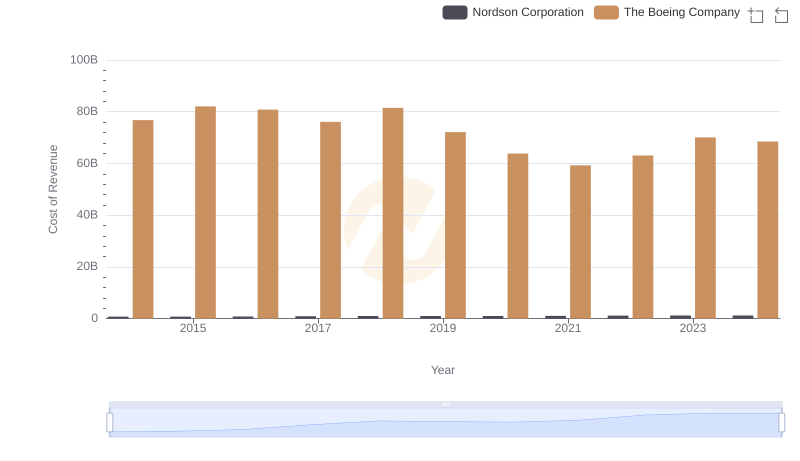
Analyzing Cost of Revenue: The Boeing Company and Nordson Corporation
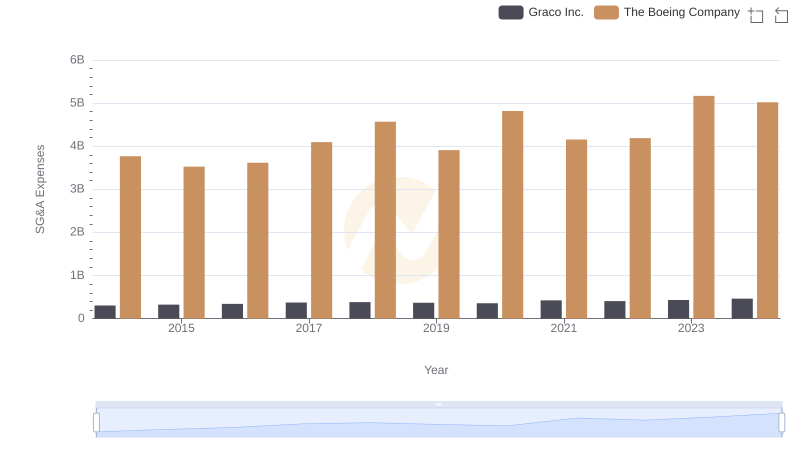
The Boeing Company and Graco Inc.: SG&A Spending Patterns Compared
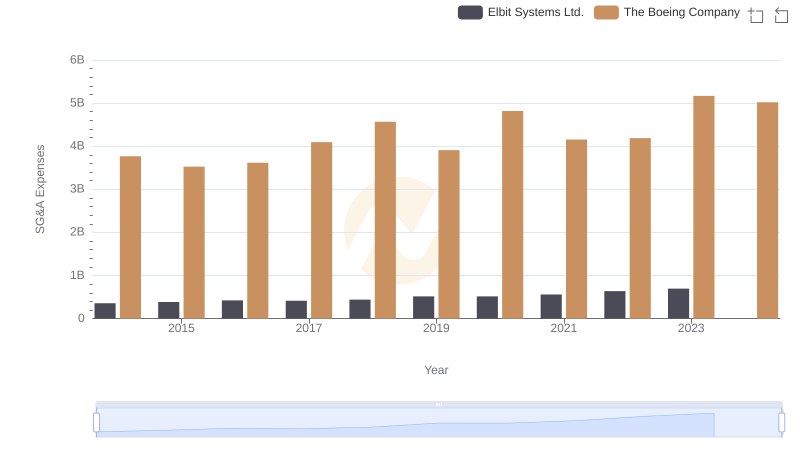
Operational Costs Compared: SG&A Analysis of The Boeing Company and Elbit Systems Ltd.
The Boeing Company or Stanley Black & Decker, Inc.: Who Manages SG&A Costs Better?

Who Optimizes SG&A Costs Better? The Boeing Company or Curtiss-Wright Corporation