| __timestamp | Rockwell Automation, Inc. | U-Haul Holding Company |
|---|---|---|
| Wednesday, January 1, 2014 | 1346000000 | 923383000 |
| Thursday, January 1, 2015 | 1359100000 | 1076520000 |
| Friday, January 1, 2016 | 1200700000 | 1255474000 |
| Sunday, January 1, 2017 | 1258400000 | 1195593000 |
| Monday, January 1, 2018 | 1568400000 | 1123974000 |
| Tuesday, January 1, 2019 | 1150200000 | 1200955000 |
| Wednesday, January 1, 2020 | 1410200000 | 1202436000 |
| Friday, January 1, 2021 | 1808300000 | 1627442000 |
| Saturday, January 1, 2022 | 1432100000 | 2337788000 |
| Sunday, January 1, 2023 | 1990700000 | 2183839000 |
| Monday, January 1, 2024 | 1567500000 | 1919656000 |
In pursuit of knowledge
In the ever-evolving landscape of American industry, Rockwell Automation and U-Haul Holding Company stand as titans in their respective fields. Over the past decade, from 2014 to 2024, these companies have demonstrated remarkable EBITDA growth, reflecting their strategic prowess and market adaptability.
Rockwell Automation has shown a consistent upward trajectory, with its EBITDA peaking in 2023 at nearly 36% higher than its 2014 figures. This growth underscores the company's commitment to innovation and efficiency in the automation sector.
U-Haul, a leader in the moving and storage industry, has also seen significant EBITDA growth, with a notable 153% increase from 2014 to 2022. This surge highlights U-Haul's ability to capitalize on market demands and expand its service offerings.
Both companies exemplify resilience and strategic foresight, making them key players to watch in the coming years.
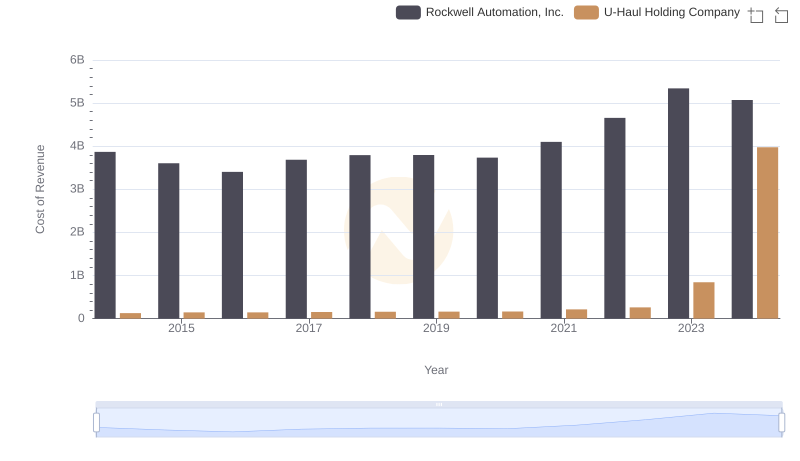
Analyzing Cost of Revenue: Rockwell Automation, Inc. and U-Haul Holding Company
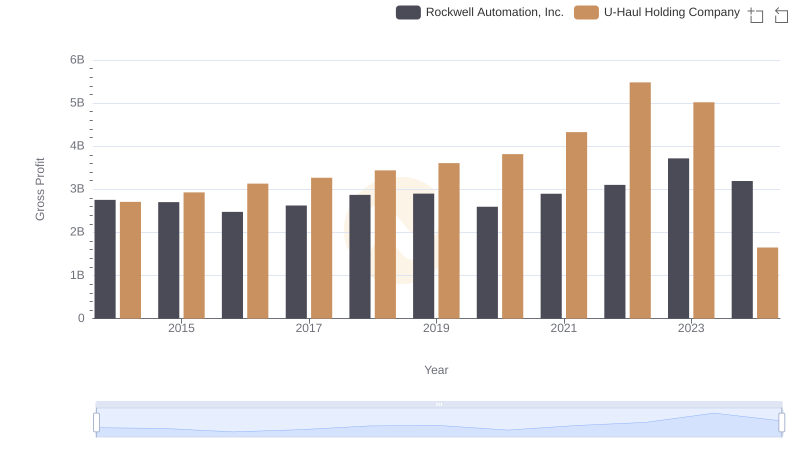
Who Generates Higher Gross Profit? Rockwell Automation, Inc. or U-Haul Holding Company

SG&A Efficiency Analysis: Comparing Rockwell Automation, Inc. and U-Haul Holding Company

Comparative EBITDA Analysis: Rockwell Automation, Inc. vs AECOM
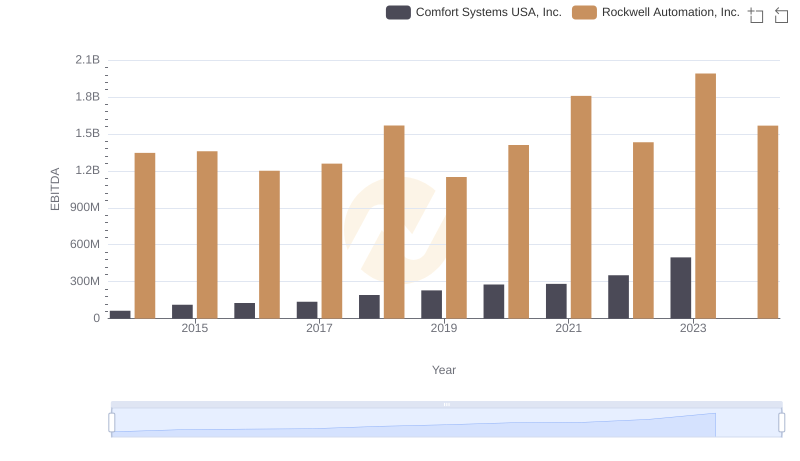
EBITDA Metrics Evaluated: Rockwell Automation, Inc. vs Comfort Systems USA, Inc.
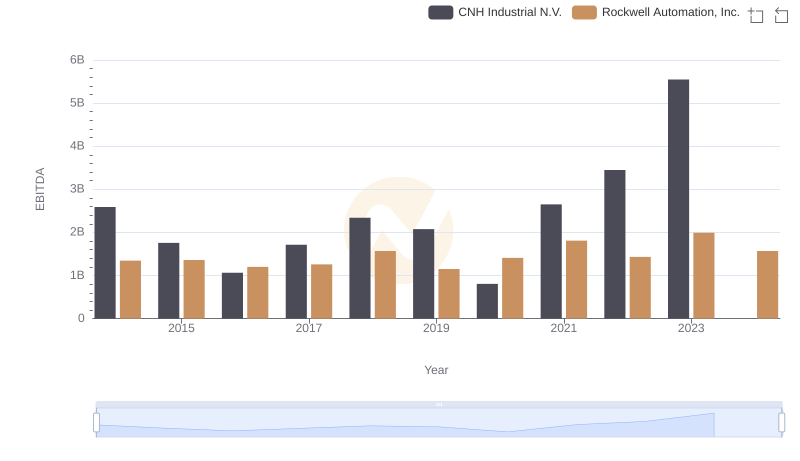
A Side-by-Side Analysis of EBITDA: Rockwell Automation, Inc. and CNH Industrial N.V.
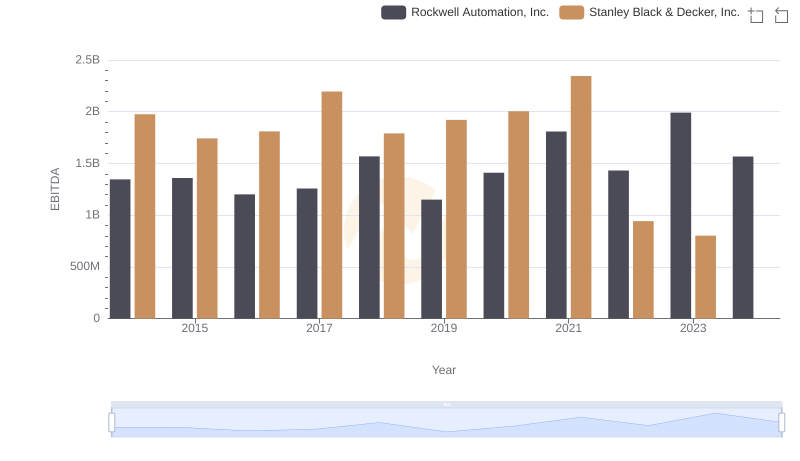
Comprehensive EBITDA Comparison: Rockwell Automation, Inc. vs Stanley Black & Decker, Inc.
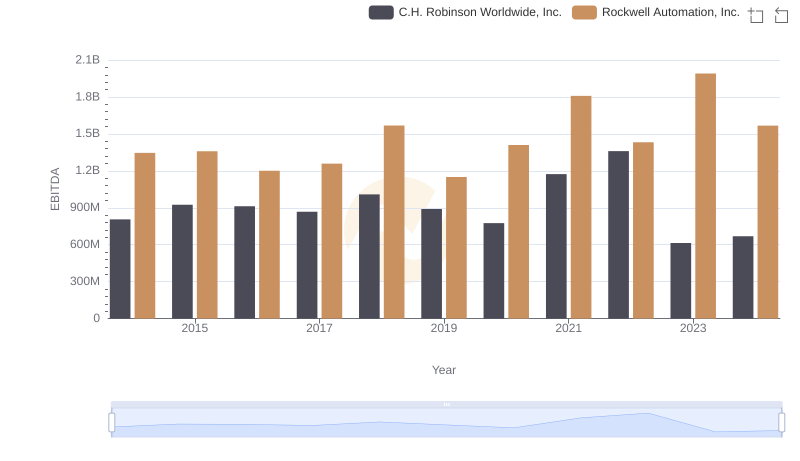
Rockwell Automation, Inc. and C.H. Robinson Worldwide, Inc.: A Detailed Examination of EBITDA Performance