| __timestamp | Parker-Hannifin Corporation | United Rentals, Inc. |
|---|---|---|
| Wednesday, January 1, 2014 | 10188227000 | 3253000000 |
| Thursday, January 1, 2015 | 9655245000 | 3337000000 |
| Friday, January 1, 2016 | 8823384000 | 3359000000 |
| Sunday, January 1, 2017 | 9188962000 | 3872000000 |
| Monday, January 1, 2018 | 10762841000 | 4683000000 |
| Tuesday, January 1, 2019 | 10703484000 | 5681000000 |
| Wednesday, January 1, 2020 | 10286518000 | 5347000000 |
| Friday, January 1, 2021 | 10449680000 | 5863000000 |
| Saturday, January 1, 2022 | 11387267000 | 6646000000 |
| Sunday, January 1, 2023 | 12635892000 | 8519000000 |
| Monday, January 1, 2024 | 12801816000 | 9195000000 |
Unveiling the hidden dimensions of data
In the ever-evolving landscape of industrial and rental services, Parker-Hannifin Corporation and United Rentals, Inc. stand as titans. Over the past decade, Parker-Hannifin has consistently demonstrated robust growth in its cost of revenue, peaking at approximately $12.8 billion in 2024, a 25% increase from 2014. This reflects the company's strategic expansion and operational efficiency. Meanwhile, United Rentals, Inc. has shown an even more impressive trajectory, with its cost of revenue surging by nearly 183% from 2014 to 2024, reaching around $9.2 billion. This growth underscores the company's aggressive market penetration and scaling efforts. The data reveals a compelling narrative of industrial prowess and strategic foresight, offering valuable insights into the financial dynamics of these industry leaders. As we delve into these figures, it becomes evident that both companies are not just surviving but thriving in a competitive market.
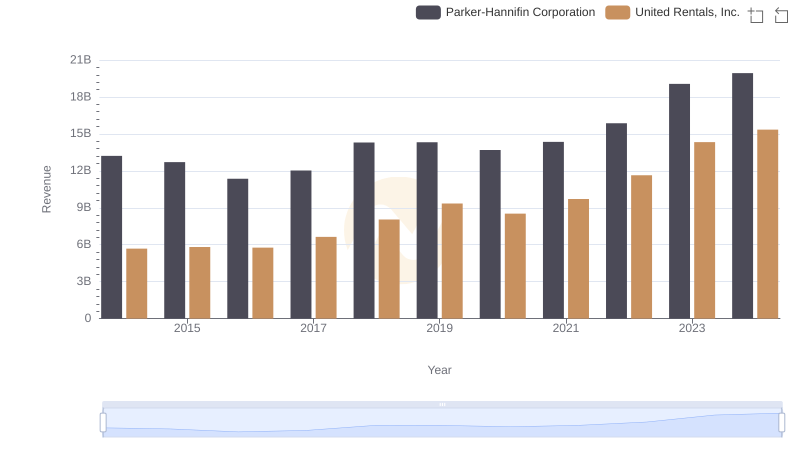
Parker-Hannifin Corporation vs United Rentals, Inc.: Examining Key Revenue Metrics
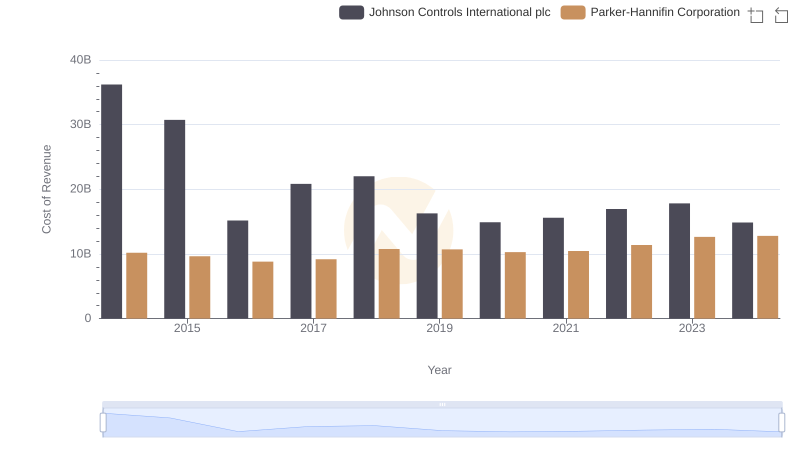
Cost of Revenue Comparison: Parker-Hannifin Corporation vs Johnson Controls International plc
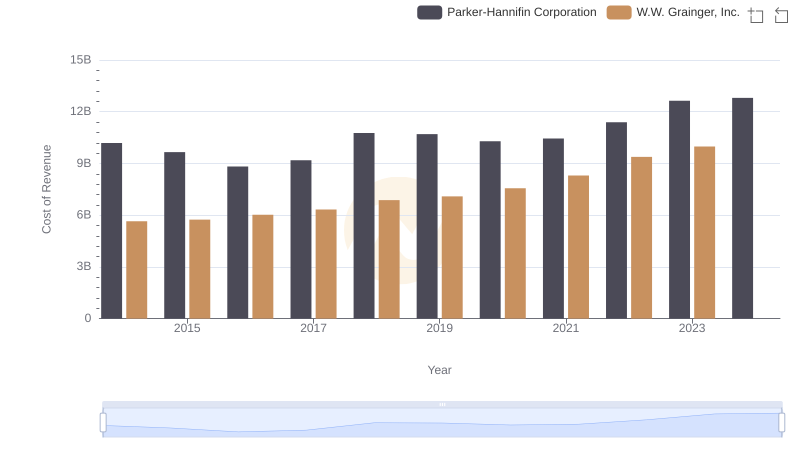
Comparing Cost of Revenue Efficiency: Parker-Hannifin Corporation vs W.W. Grainger, Inc.
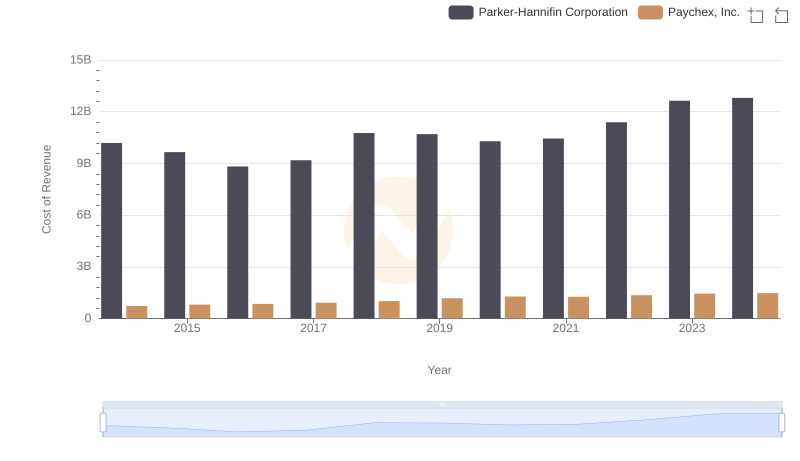
Comparing Cost of Revenue Efficiency: Parker-Hannifin Corporation vs Paychex, Inc.
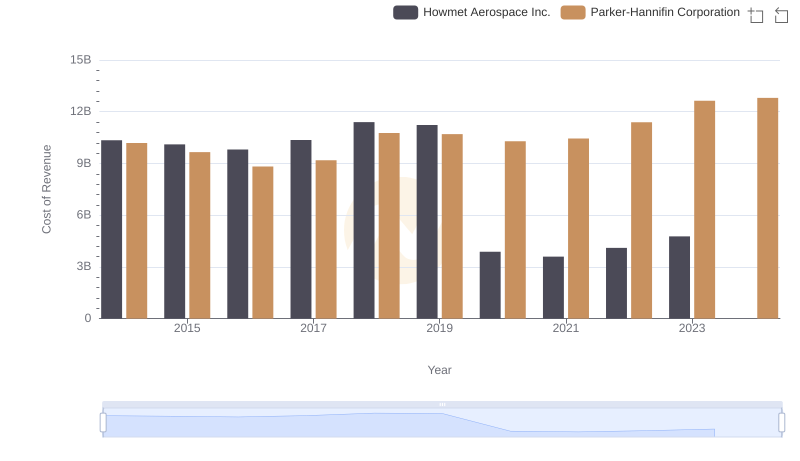
Analyzing Cost of Revenue: Parker-Hannifin Corporation and Howmet Aerospace Inc.
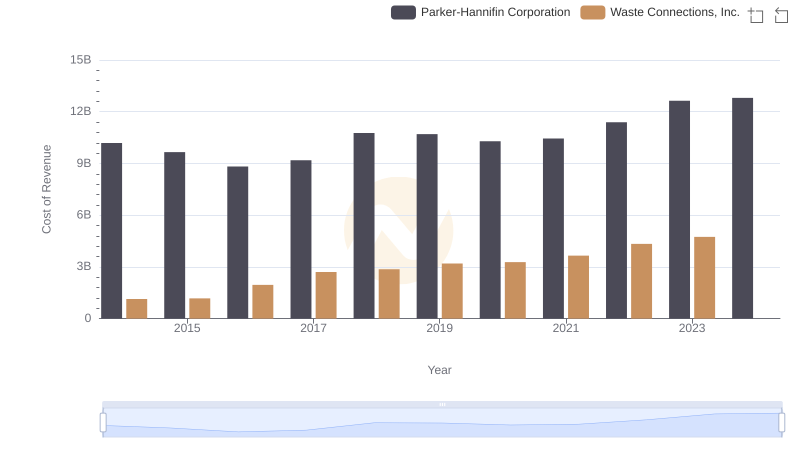
Cost Insights: Breaking Down Parker-Hannifin Corporation and Waste Connections, Inc.'s Expenses
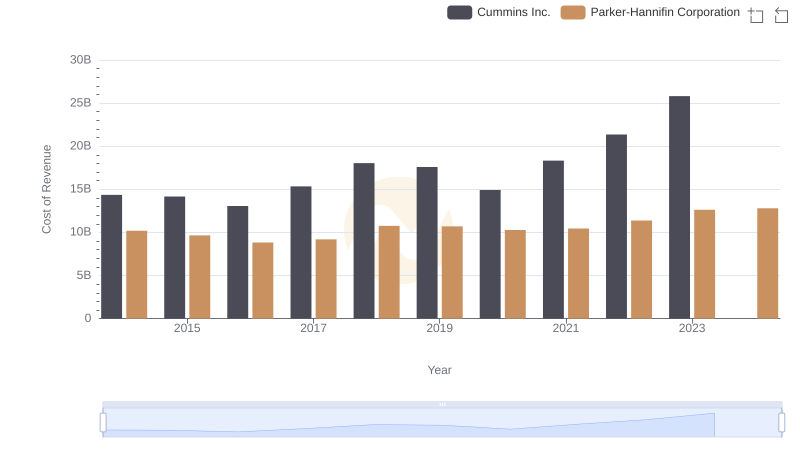
Analyzing Cost of Revenue: Parker-Hannifin Corporation and Cummins Inc.
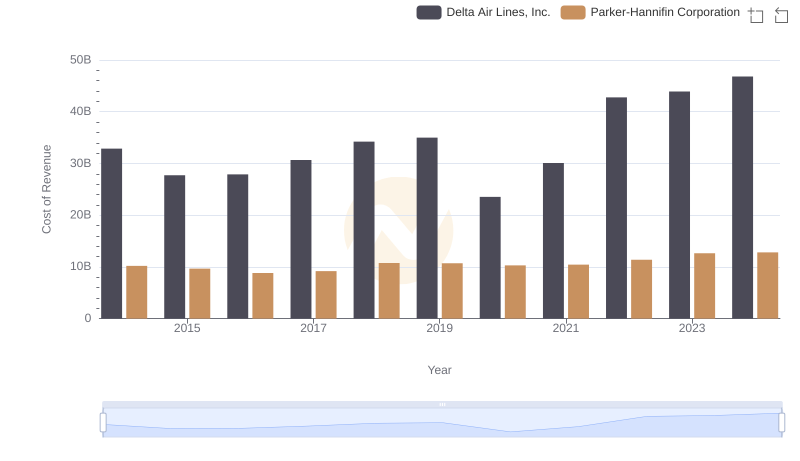
Cost of Revenue Trends: Parker-Hannifin Corporation vs Delta Air Lines, Inc.
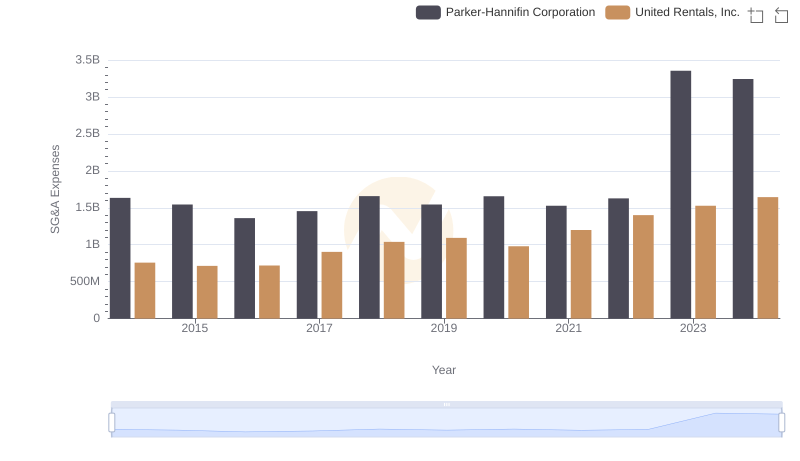
Who Optimizes SG&A Costs Better? Parker-Hannifin Corporation or United Rentals, Inc.
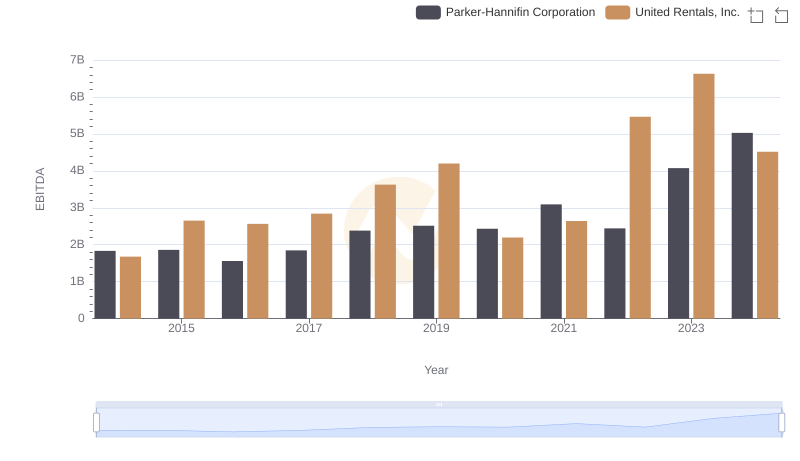
A Professional Review of EBITDA: Parker-Hannifin Corporation Compared to United Rentals, Inc.