| __timestamp | Parker-Hannifin Corporation | United Rentals, Inc. |
|---|---|---|
| Wednesday, January 1, 2014 | 13215971000 | 5685000000 |
| Thursday, January 1, 2015 | 12711744000 | 5817000000 |
| Friday, January 1, 2016 | 11360753000 | 5762000000 |
| Sunday, January 1, 2017 | 12029312000 | 6641000000 |
| Monday, January 1, 2018 | 14302392000 | 8047000000 |
| Tuesday, January 1, 2019 | 14320324000 | 9351000000 |
| Wednesday, January 1, 2020 | 13695520000 | 8530000000 |
| Friday, January 1, 2021 | 14347640000 | 9716000000 |
| Saturday, January 1, 2022 | 15861608000 | 11642000000 |
| Sunday, January 1, 2023 | 19065194000 | 14332000000 |
| Monday, January 1, 2024 | 19929606000 | 15345000000 |
Unleashing insights
In the ever-evolving landscape of industrial giants, Parker-Hannifin Corporation and United Rentals, Inc. have consistently demonstrated their prowess. Over the past decade, Parker-Hannifin has seen its revenue grow by approximately 51%, from $13.2 billion in 2014 to nearly $20 billion in 2024. Meanwhile, United Rentals has experienced an even more impressive surge, with revenue climbing by 170%, from $5.7 billion to $15.3 billion in the same period.
Parker-Hannifin's steady growth reflects its robust market strategies and adaptability, while United Rentals' rapid expansion underscores its aggressive market penetration and strategic acquisitions. By 2023, United Rentals' revenue had reached 75% of Parker-Hannifin's, a significant leap from just 43% in 2014.
As these industrial titans continue to innovate and expand, their revenue trajectories offer valuable insights into the broader economic trends and industrial growth patterns.
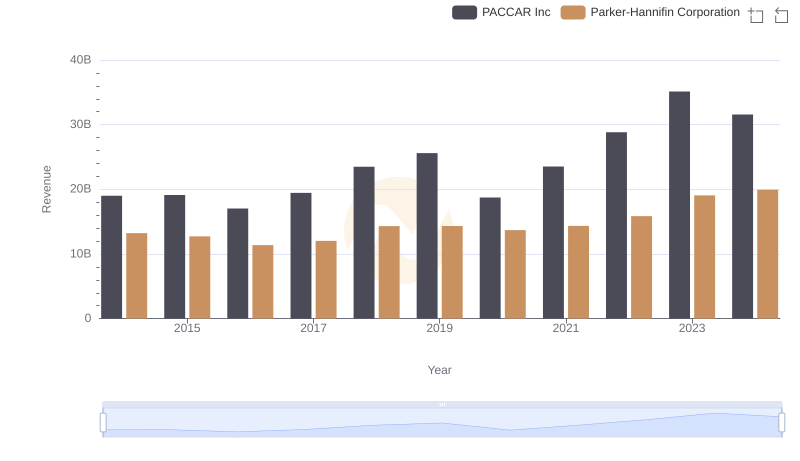
Comparing Revenue Performance: Parker-Hannifin Corporation or PACCAR Inc?
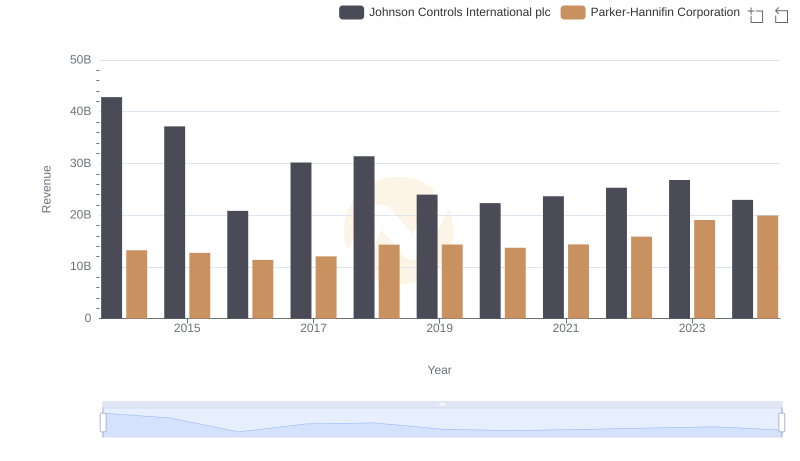
Who Generates More Revenue? Parker-Hannifin Corporation or Johnson Controls International plc
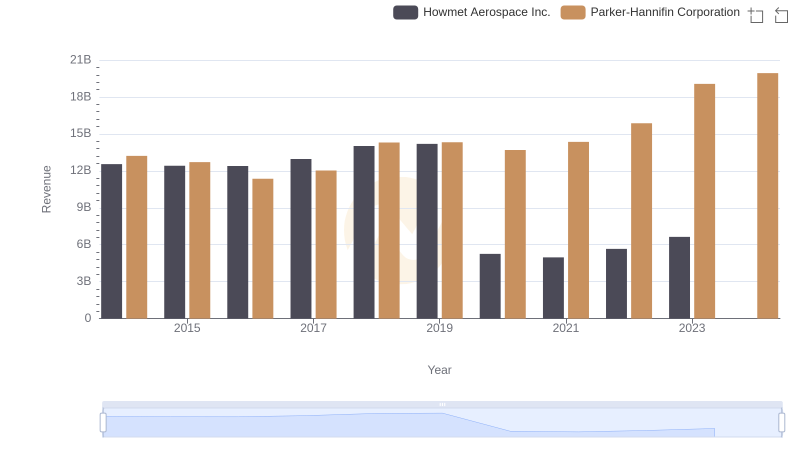
Breaking Down Revenue Trends: Parker-Hannifin Corporation vs Howmet Aerospace Inc.
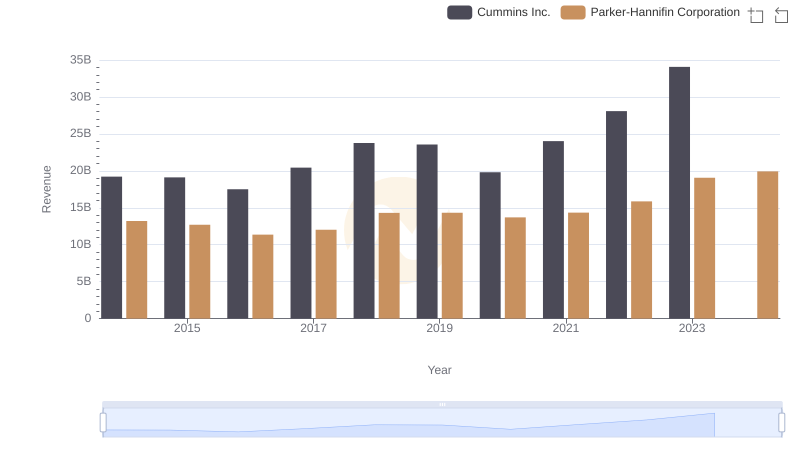
Parker-Hannifin Corporation vs Cummins Inc.: Examining Key Revenue Metrics
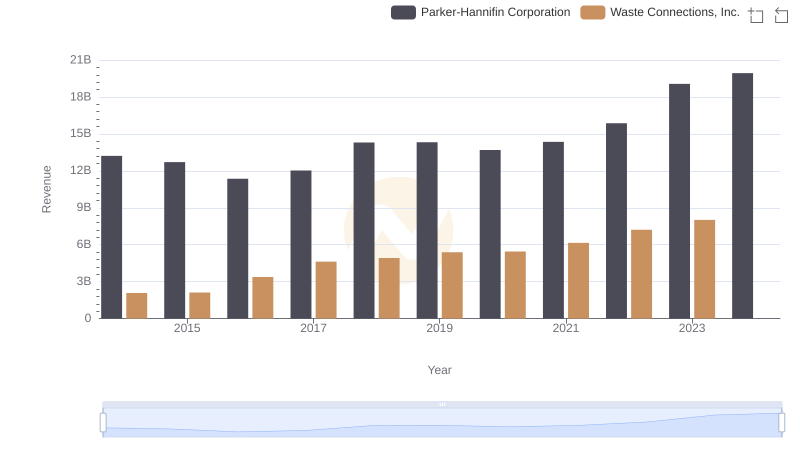
Parker-Hannifin Corporation vs Waste Connections, Inc.: Annual Revenue Growth Compared
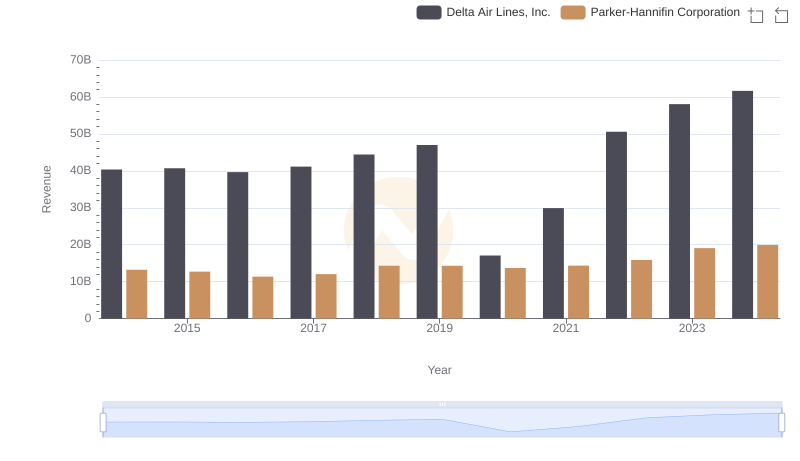
Parker-Hannifin Corporation or Delta Air Lines, Inc.: Who Leads in Yearly Revenue?
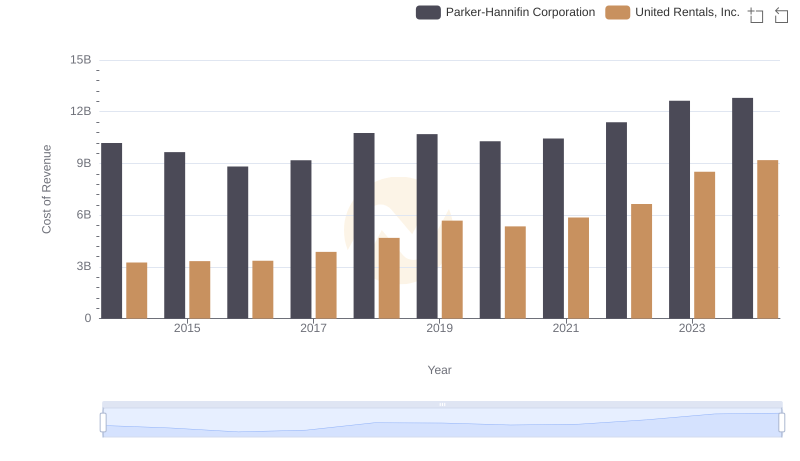
Analyzing Cost of Revenue: Parker-Hannifin Corporation and United Rentals, Inc.
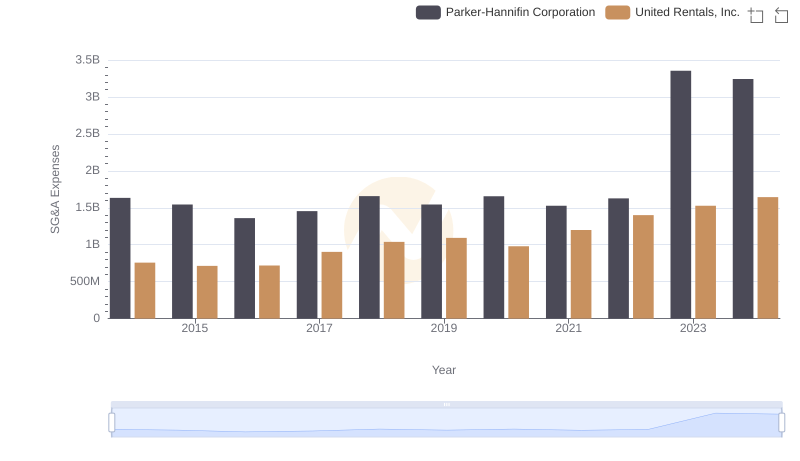
Who Optimizes SG&A Costs Better? Parker-Hannifin Corporation or United Rentals, Inc.
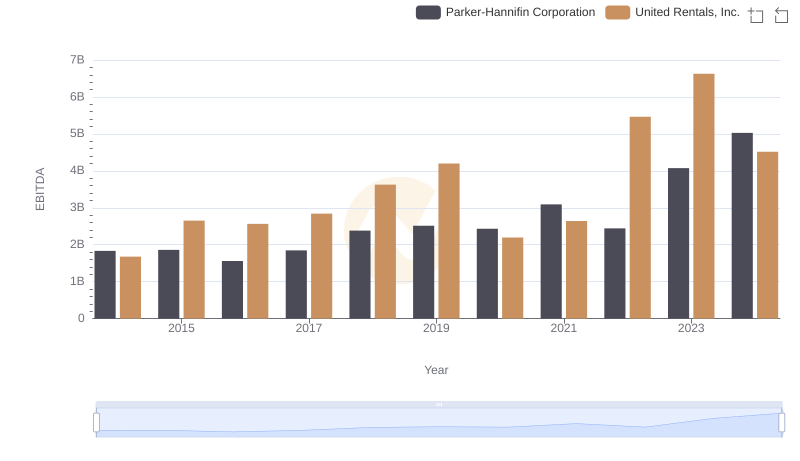
A Professional Review of EBITDA: Parker-Hannifin Corporation Compared to United Rentals, Inc.