| __timestamp | Parker-Hannifin Corporation | Waste Connections, Inc. |
|---|---|---|
| Wednesday, January 1, 2014 | 10188227000 | 1138388000 |
| Thursday, January 1, 2015 | 9655245000 | 1177409000 |
| Friday, January 1, 2016 | 8823384000 | 1957712000 |
| Sunday, January 1, 2017 | 9188962000 | 2704775000 |
| Monday, January 1, 2018 | 10762841000 | 2865704000 |
| Tuesday, January 1, 2019 | 10703484000 | 3198757000 |
| Wednesday, January 1, 2020 | 10286518000 | 3276808000 |
| Friday, January 1, 2021 | 10449680000 | 3654074000 |
| Saturday, January 1, 2022 | 11387267000 | 4336012000 |
| Sunday, January 1, 2023 | 12635892000 | 4744513000 |
| Monday, January 1, 2024 | 12801816000 | 5191706000 |
Unveiling the hidden dimensions of data
In the ever-evolving landscape of industrial giants, understanding cost structures is pivotal. Parker-Hannifin Corporation, a leader in motion and control technologies, and Waste Connections, Inc., a prominent player in waste management, offer intriguing insights into their financial journeys from 2014 to 2023.
Parker-Hannifin's cost of revenue has seen a steady climb, peaking at approximately 28% higher in 2023 compared to 2014. This growth reflects their strategic expansions and innovations. Meanwhile, Waste Connections has experienced a remarkable surge, with costs nearly quadrupling over the same period, underscoring their aggressive market penetration and service diversification.
Interestingly, 2024 data for Waste Connections remains elusive, hinting at potential shifts or reporting delays. As these companies navigate economic challenges and opportunities, their cost trajectories offer a window into their operational strategies and market adaptations.
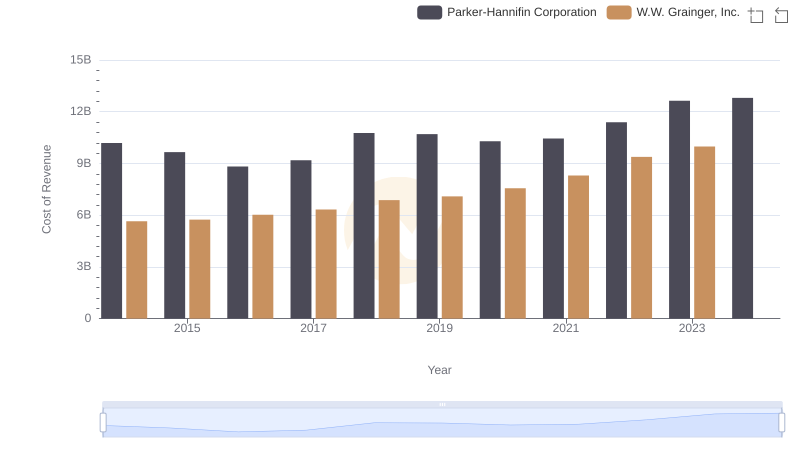
Comparing Cost of Revenue Efficiency: Parker-Hannifin Corporation vs W.W. Grainger, Inc.
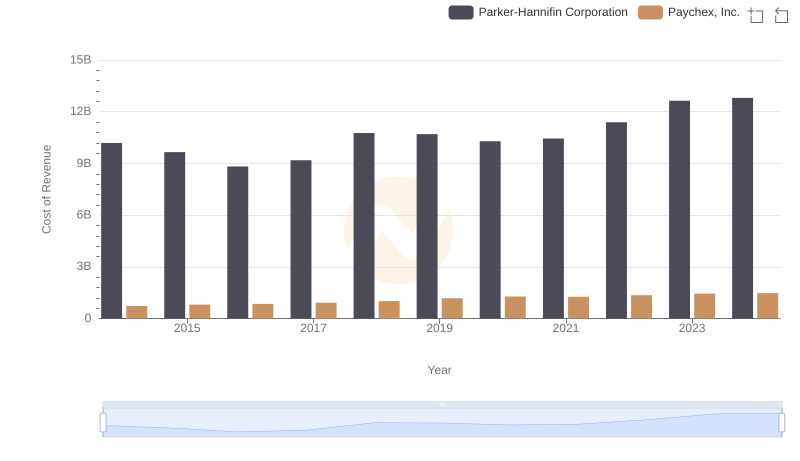
Comparing Cost of Revenue Efficiency: Parker-Hannifin Corporation vs Paychex, Inc.
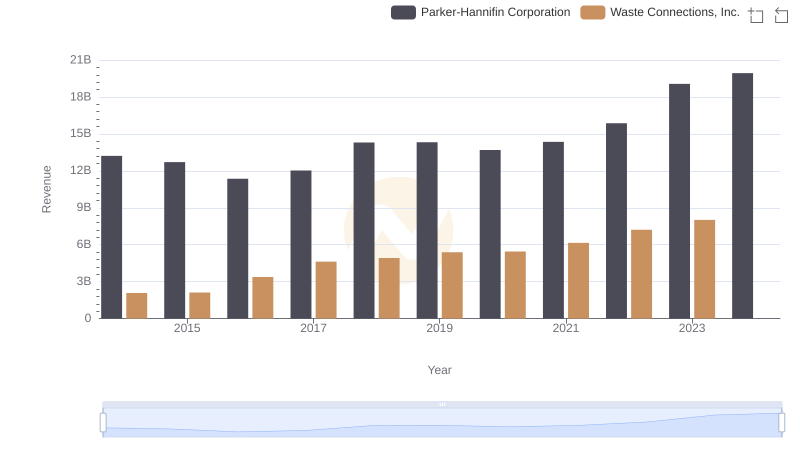
Parker-Hannifin Corporation vs Waste Connections, Inc.: Annual Revenue Growth Compared
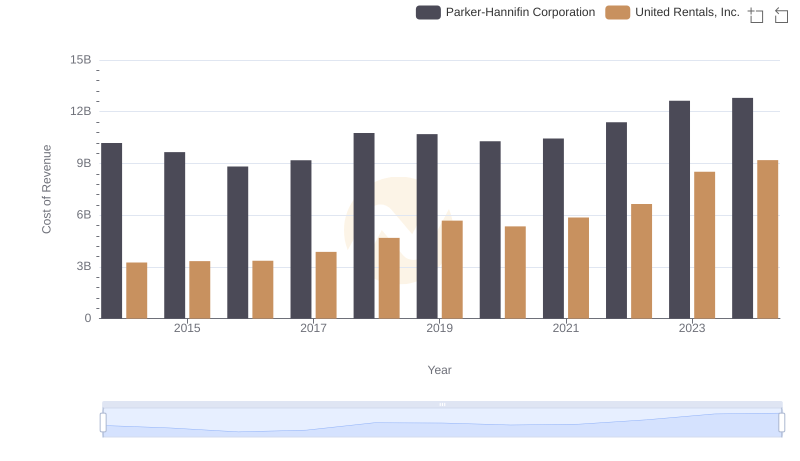
Analyzing Cost of Revenue: Parker-Hannifin Corporation and United Rentals, Inc.
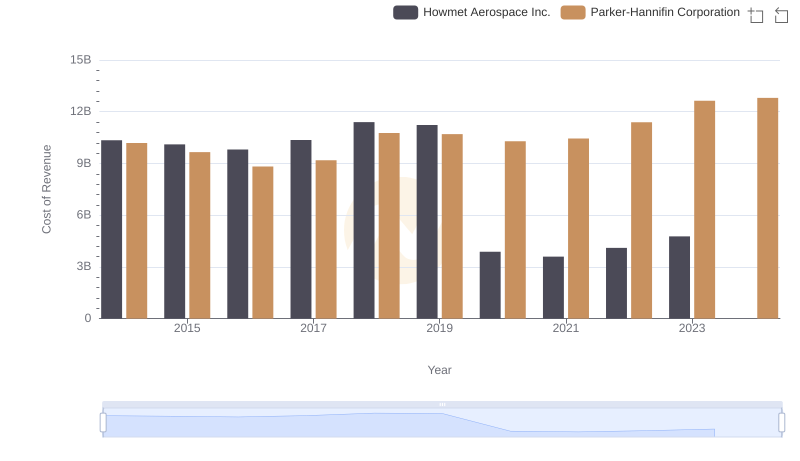
Analyzing Cost of Revenue: Parker-Hannifin Corporation and Howmet Aerospace Inc.
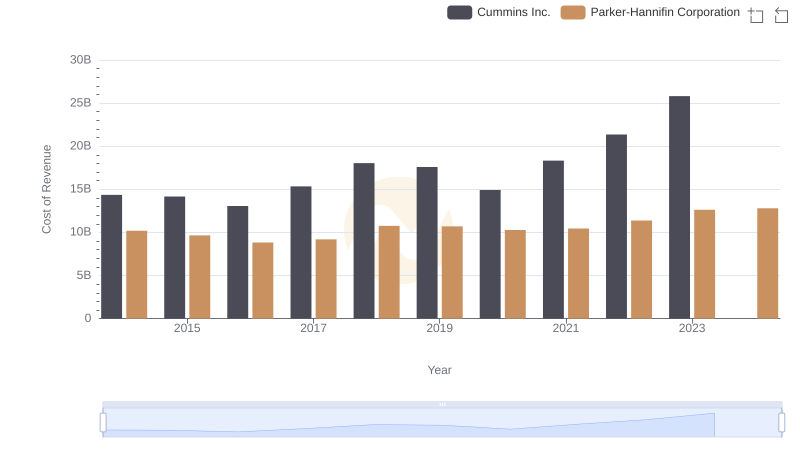
Analyzing Cost of Revenue: Parker-Hannifin Corporation and Cummins Inc.
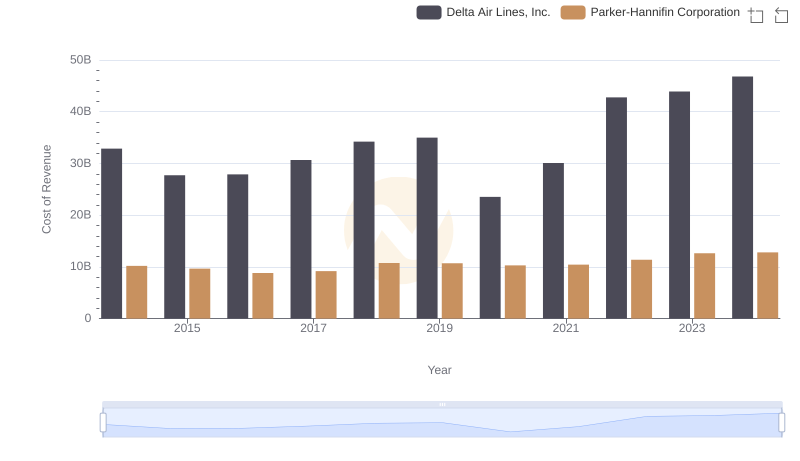
Cost of Revenue Trends: Parker-Hannifin Corporation vs Delta Air Lines, Inc.
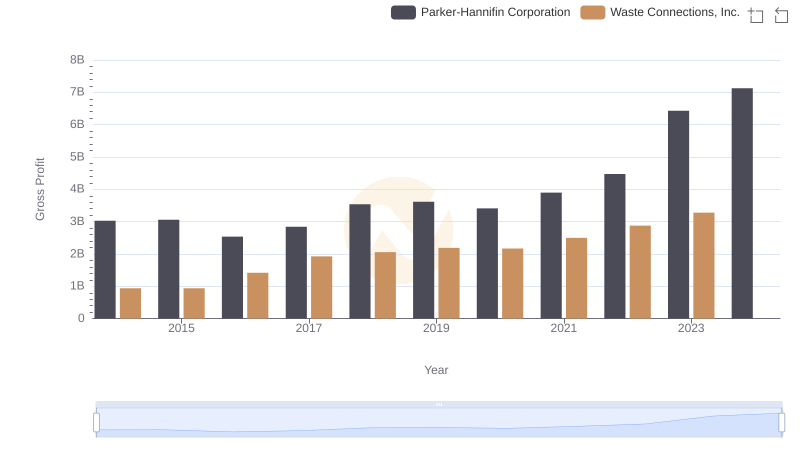
Parker-Hannifin Corporation vs Waste Connections, Inc.: A Gross Profit Performance Breakdown

Parker-Hannifin Corporation or Waste Connections, Inc.: Who Manages SG&A Costs Better?
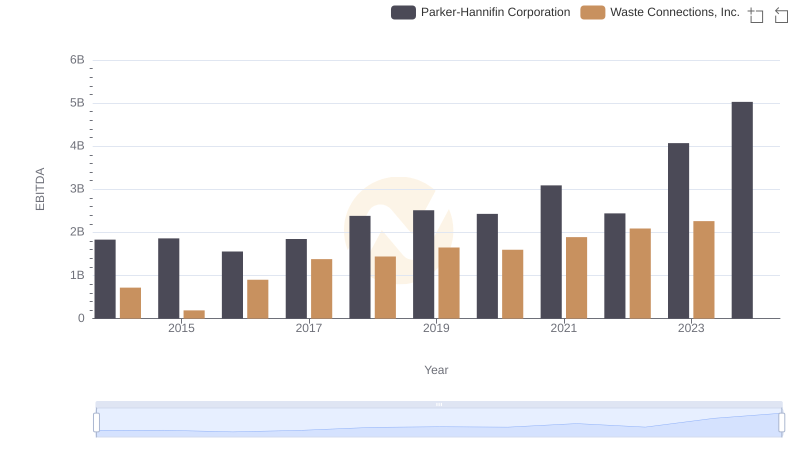
Professional EBITDA Benchmarking: Parker-Hannifin Corporation vs Waste Connections, Inc.