| __timestamp | Delta Air Lines, Inc. | Parker-Hannifin Corporation |
|---|---|---|
| Wednesday, January 1, 2014 | 32858000000 | 10188227000 |
| Thursday, January 1, 2015 | 27707000000 | 9655245000 |
| Friday, January 1, 2016 | 27876000000 | 8823384000 |
| Sunday, January 1, 2017 | 30671000000 | 9188962000 |
| Monday, January 1, 2018 | 34209000000 | 10762841000 |
| Tuesday, January 1, 2019 | 34982000000 | 10703484000 |
| Wednesday, January 1, 2020 | 23546000000 | 10286518000 |
| Friday, January 1, 2021 | 30078000000 | 10449680000 |
| Saturday, January 1, 2022 | 42767000000 | 11387267000 |
| Sunday, January 1, 2023 | 43913000000 | 12635892000 |
| Monday, January 1, 2024 | 46801000000 | 12801816000 |
Data in motion
In the ever-evolving landscape of American industry, Parker-Hannifin Corporation and Delta Air Lines, Inc. stand as titans in their respective fields. Over the past decade, these companies have navigated the turbulent waters of economic change, with their cost of revenue reflecting their strategic adaptations.
From 2014 to 2024, Delta Air Lines experienced a significant 42% increase in its cost of revenue, peaking in 2024. This surge underscores the airline's expansion and operational challenges, particularly in the post-pandemic era. In contrast, Parker-Hannifin's cost of revenue grew by approximately 26% over the same period, highlighting its steady growth in the industrial sector.
These trends offer a window into the broader economic shifts and the resilience of these corporations. As we look to the future, understanding these patterns will be crucial for investors and industry analysts alike.
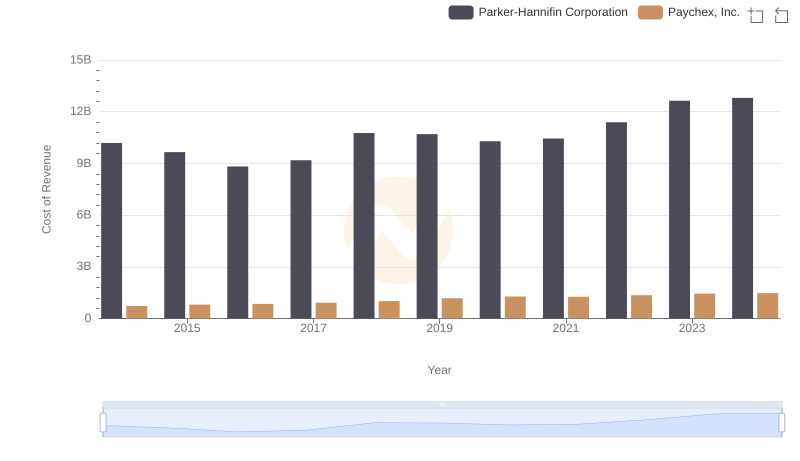
Comparing Cost of Revenue Efficiency: Parker-Hannifin Corporation vs Paychex, Inc.
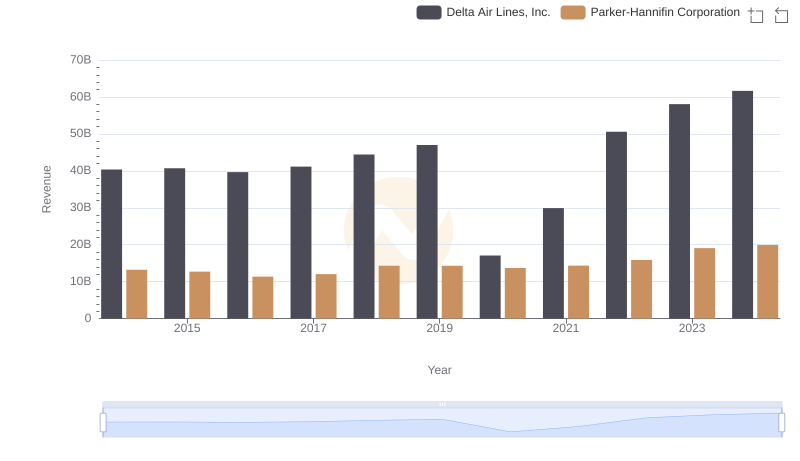
Parker-Hannifin Corporation or Delta Air Lines, Inc.: Who Leads in Yearly Revenue?
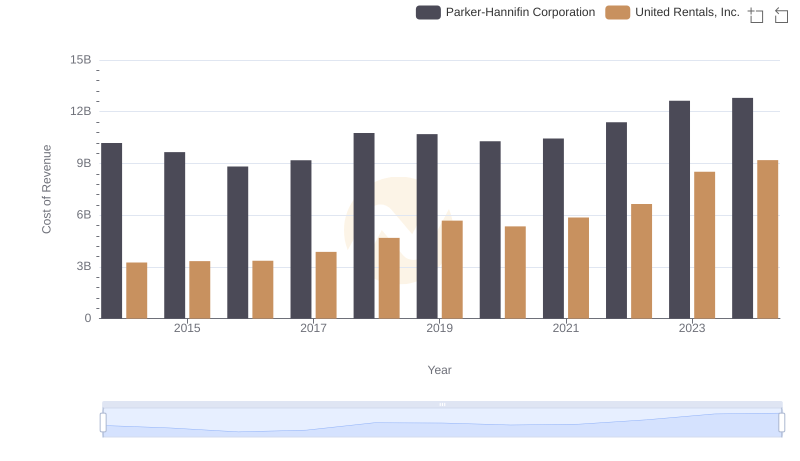
Analyzing Cost of Revenue: Parker-Hannifin Corporation and United Rentals, Inc.
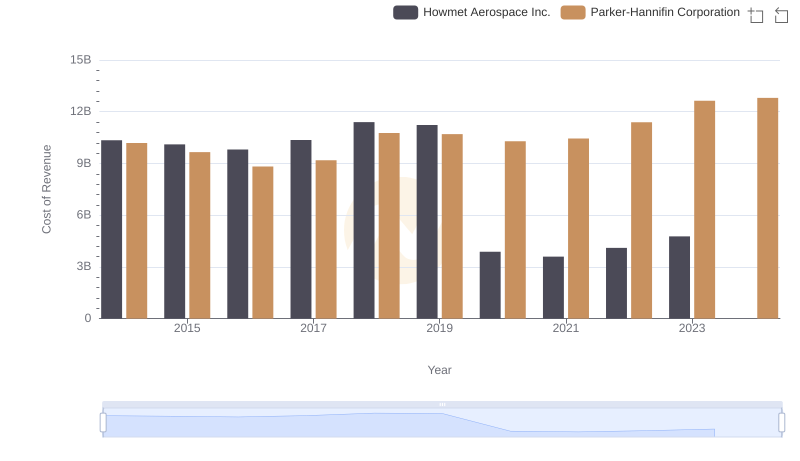
Analyzing Cost of Revenue: Parker-Hannifin Corporation and Howmet Aerospace Inc.
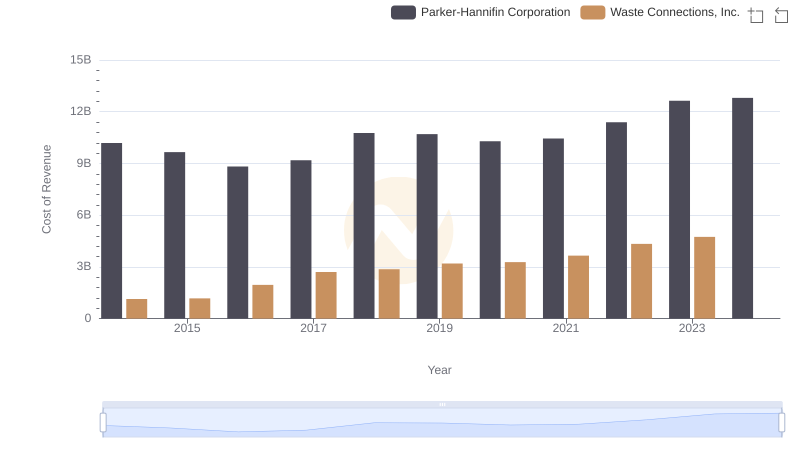
Cost Insights: Breaking Down Parker-Hannifin Corporation and Waste Connections, Inc.'s Expenses
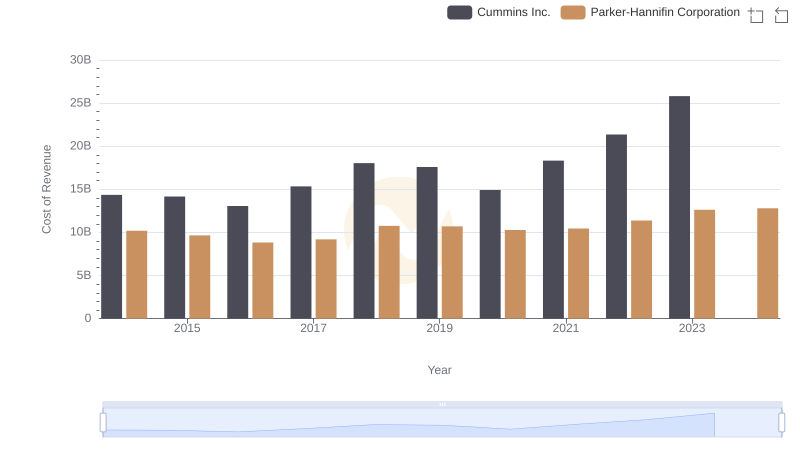
Analyzing Cost of Revenue: Parker-Hannifin Corporation and Cummins Inc.
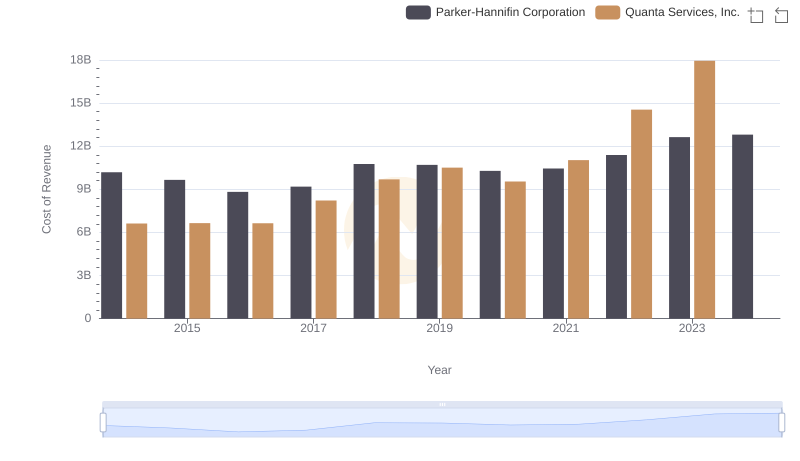
Parker-Hannifin Corporation vs Quanta Services, Inc.: Efficiency in Cost of Revenue Explored
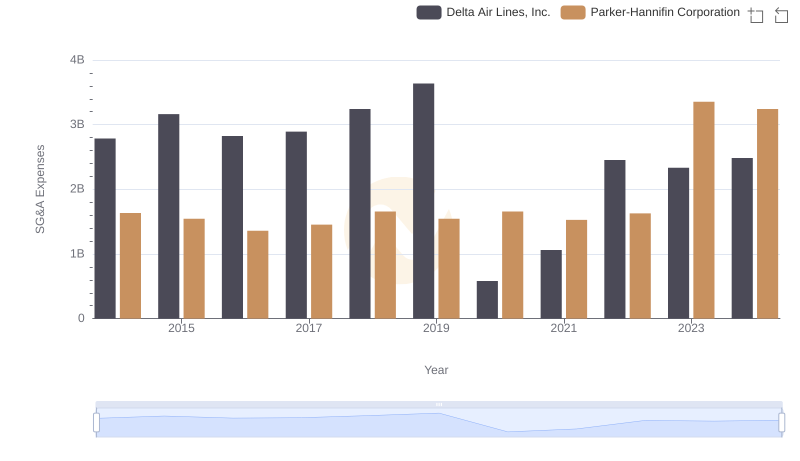
Comparing SG&A Expenses: Parker-Hannifin Corporation vs Delta Air Lines, Inc. Trends and Insights
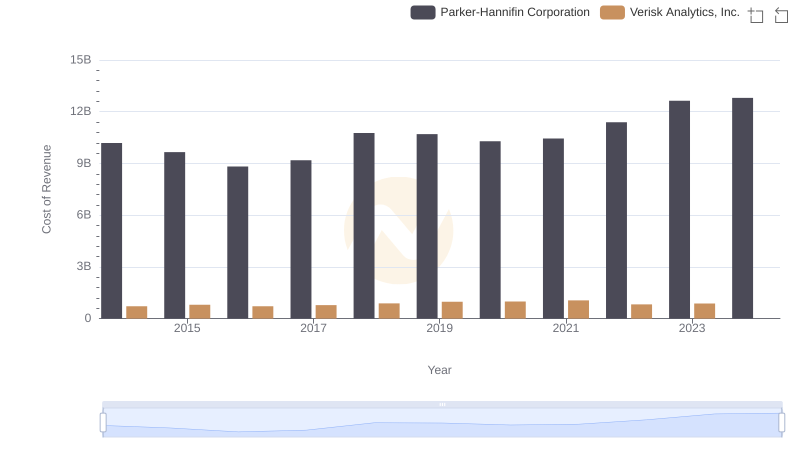
Cost of Revenue Comparison: Parker-Hannifin Corporation vs Verisk Analytics, Inc.