| __timestamp | Parker-Hannifin Corporation | W.W. Grainger, Inc. |
|---|---|---|
| Wednesday, January 1, 2014 | 10188227000 | 5650711000 |
| Thursday, January 1, 2015 | 9655245000 | 5741956000 |
| Friday, January 1, 2016 | 8823384000 | 6022647000 |
| Sunday, January 1, 2017 | 9188962000 | 6327301000 |
| Monday, January 1, 2018 | 10762841000 | 6873000000 |
| Tuesday, January 1, 2019 | 10703484000 | 7089000000 |
| Wednesday, January 1, 2020 | 10286518000 | 7559000000 |
| Friday, January 1, 2021 | 10449680000 | 8302000000 |
| Saturday, January 1, 2022 | 11387267000 | 9379000000 |
| Sunday, January 1, 2023 | 12635892000 | 9982000000 |
| Monday, January 1, 2024 | 12801816000 | 10410000000 |
Infusing magic into the data realm
In the competitive landscape of industrial manufacturing and distribution, cost efficiency is a critical metric. Parker-Hannifin Corporation and W.W. Grainger, Inc., two stalwarts in their respective fields, have shown distinct trends in their cost of revenue from 2014 to 2023. Parker-Hannifin has demonstrated a steady increase, with a notable 25% rise from 2014 to 2023. In contrast, W.W. Grainger, Inc. has also seen growth, albeit at a slower pace, with a 77% increase over the same period. This divergence highlights Parker-Hannifin's robust cost management strategies, especially in recent years. However, the data for 2024 is incomplete, leaving room for speculation on future trends. As these companies continue to evolve, their cost efficiency will remain a key indicator of their operational success.
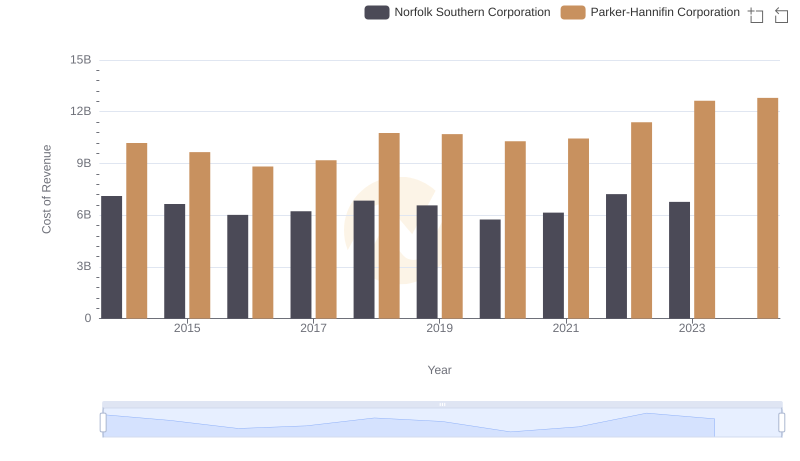
Analyzing Cost of Revenue: Parker-Hannifin Corporation and Norfolk Southern Corporation
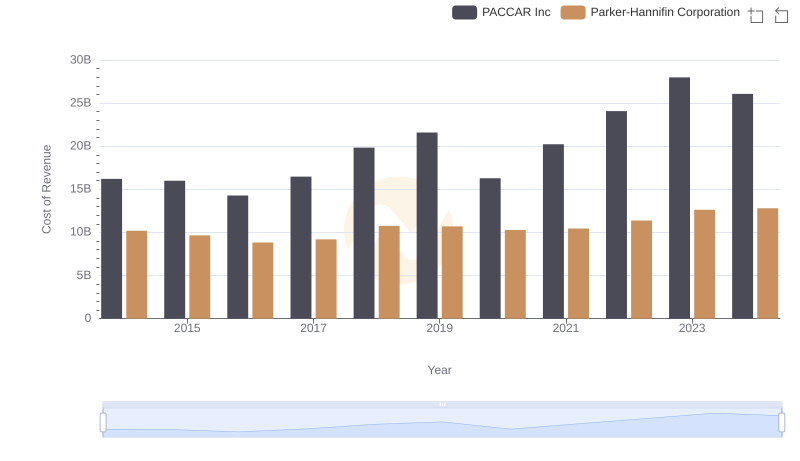
Comparing Cost of Revenue Efficiency: Parker-Hannifin Corporation vs PACCAR Inc
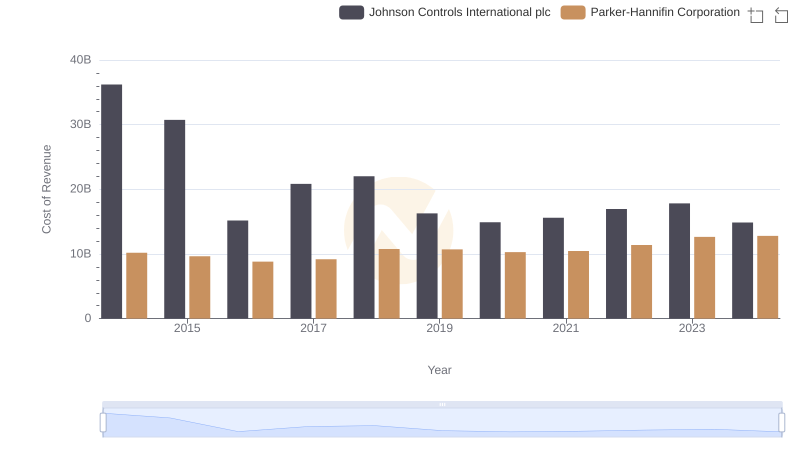
Cost of Revenue Comparison: Parker-Hannifin Corporation vs Johnson Controls International plc
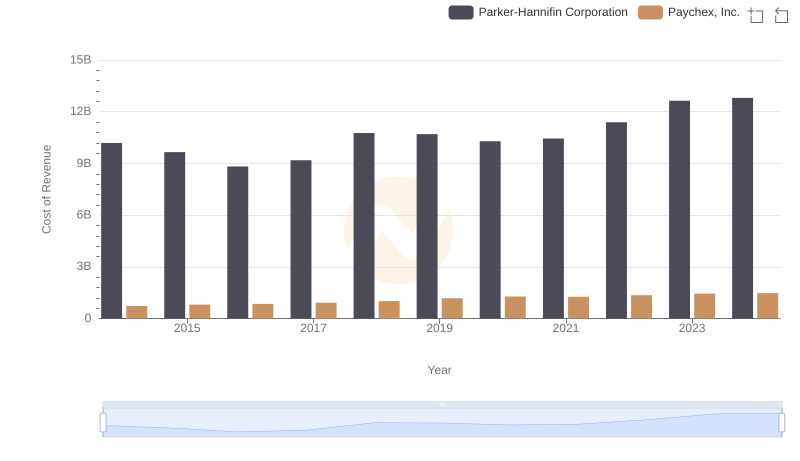
Comparing Cost of Revenue Efficiency: Parker-Hannifin Corporation vs Paychex, Inc.
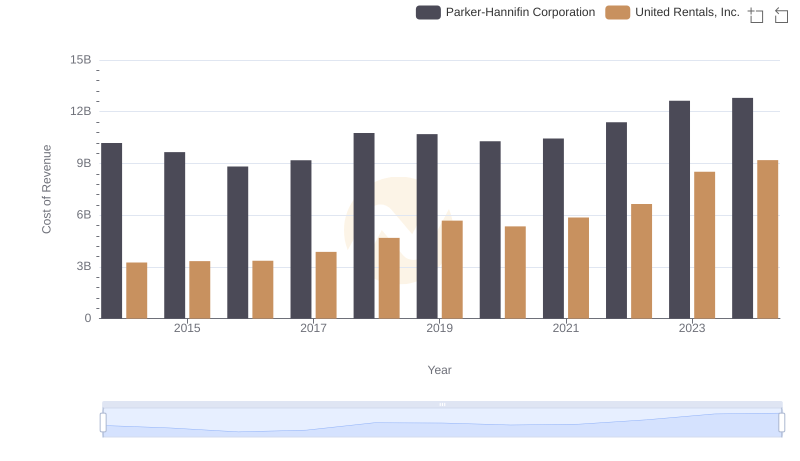
Analyzing Cost of Revenue: Parker-Hannifin Corporation and United Rentals, Inc.
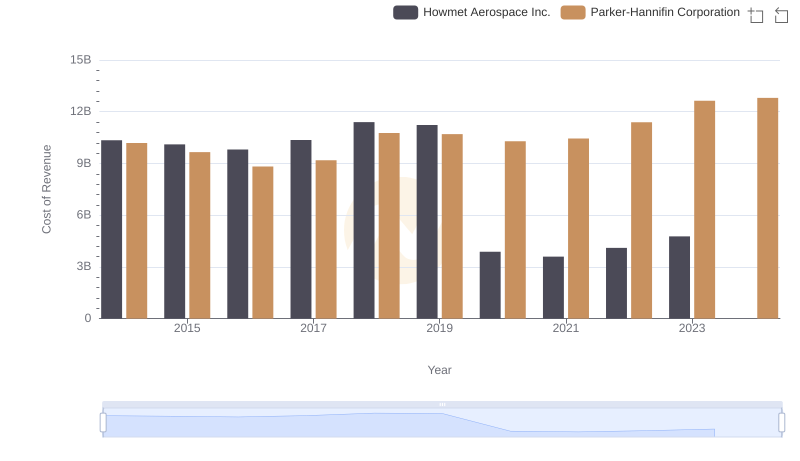
Analyzing Cost of Revenue: Parker-Hannifin Corporation and Howmet Aerospace Inc.
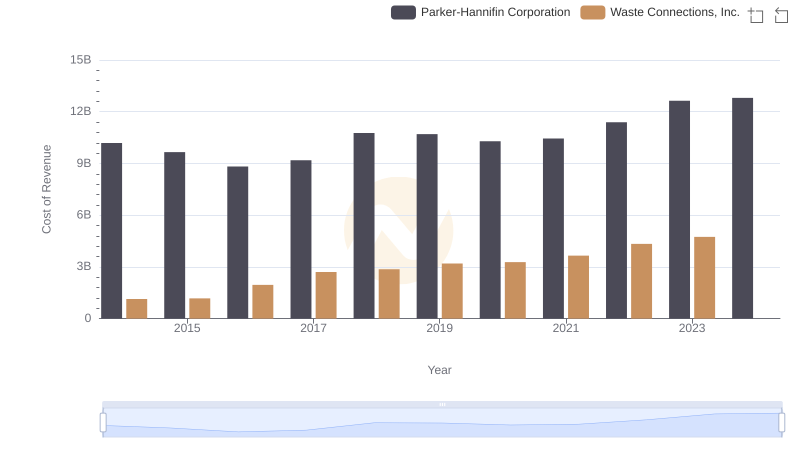
Cost Insights: Breaking Down Parker-Hannifin Corporation and Waste Connections, Inc.'s Expenses
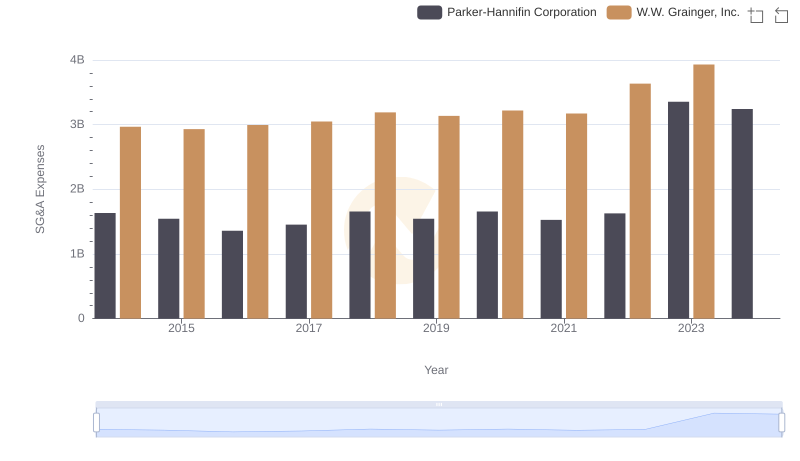
Selling, General, and Administrative Costs: Parker-Hannifin Corporation vs W.W. Grainger, Inc.