| __timestamp | C.H. Robinson Worldwide, Inc. | Parker-Hannifin Corporation |
|---|---|---|
| Wednesday, January 1, 2014 | 12401436000 | 10188227000 |
| Thursday, January 1, 2015 | 12259014000 | 9655245000 |
| Friday, January 1, 2016 | 11931821000 | 8823384000 |
| Sunday, January 1, 2017 | 13680857000 | 9188962000 |
| Monday, January 1, 2018 | 15269479000 | 10762841000 |
| Tuesday, January 1, 2019 | 14021726000 | 10703484000 |
| Wednesday, January 1, 2020 | 15037716000 | 10286518000 |
| Friday, January 1, 2021 | 21493659000 | 10449680000 |
| Saturday, January 1, 2022 | 22826428000 | 11387267000 |
| Sunday, January 1, 2023 | 16457570000 | 12635892000 |
| Monday, January 1, 2024 | 16416191000 | 12801816000 |
Unlocking the unknown
In the ever-evolving landscape of industrial and logistics sectors, understanding cost dynamics is crucial. From 2014 to 2023, Parker-Hannifin Corporation and C.H. Robinson Worldwide, Inc. have showcased intriguing trends in their cost of revenue. Parker-Hannifin's cost of revenue has seen a steady increase, peaking at approximately $12.6 billion in 2023, marking a 24% rise from 2014. In contrast, C.H. Robinson experienced a more volatile trajectory, with a significant spike in 2021, reaching over $21 billion, before dropping to $16.5 billion in 2023. This fluctuation highlights the challenges faced by logistics companies in managing costs amidst global disruptions. Notably, the data for 2024 is incomplete, indicating potential shifts in the coming year. These insights provide a window into the strategic financial maneuvers of these industry giants, offering valuable lessons for stakeholders and investors alike.
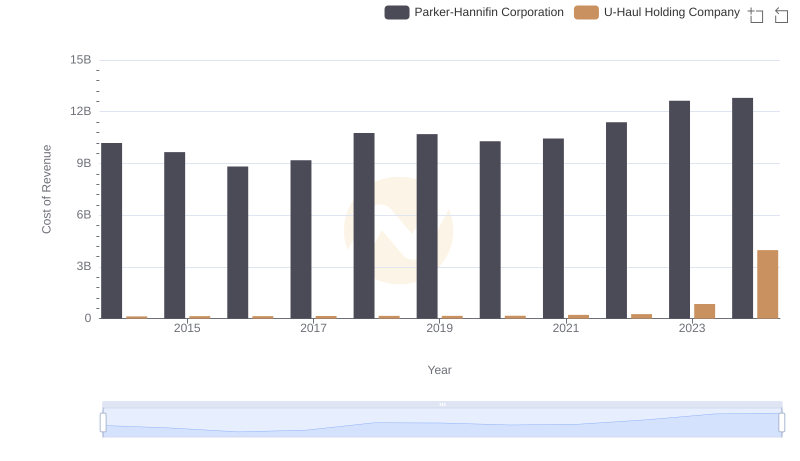
Cost Insights: Breaking Down Parker-Hannifin Corporation and U-Haul Holding Company's Expenses
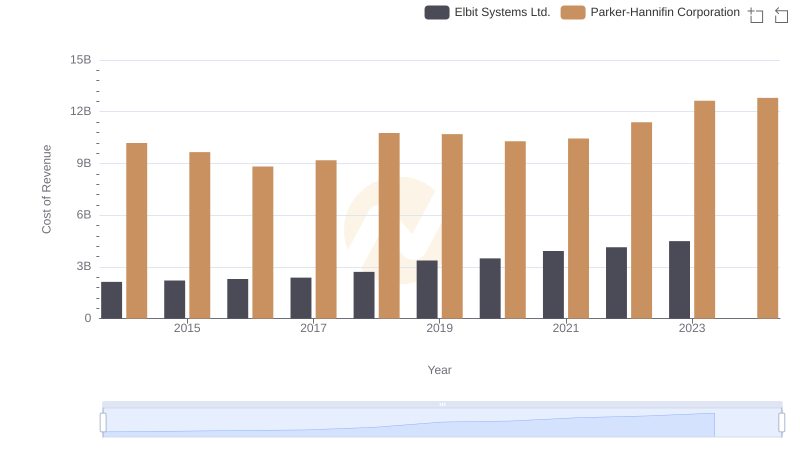
Cost of Revenue Trends: Parker-Hannifin Corporation vs Elbit Systems Ltd.
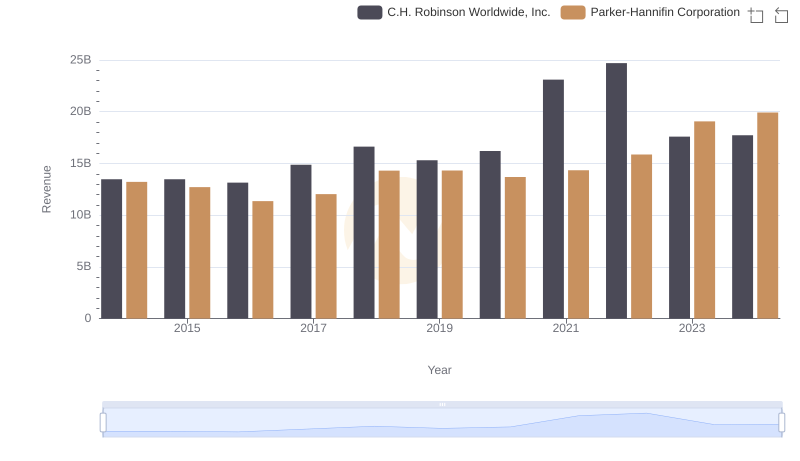
Revenue Insights: Parker-Hannifin Corporation and C.H. Robinson Worldwide, Inc. Performance Compared
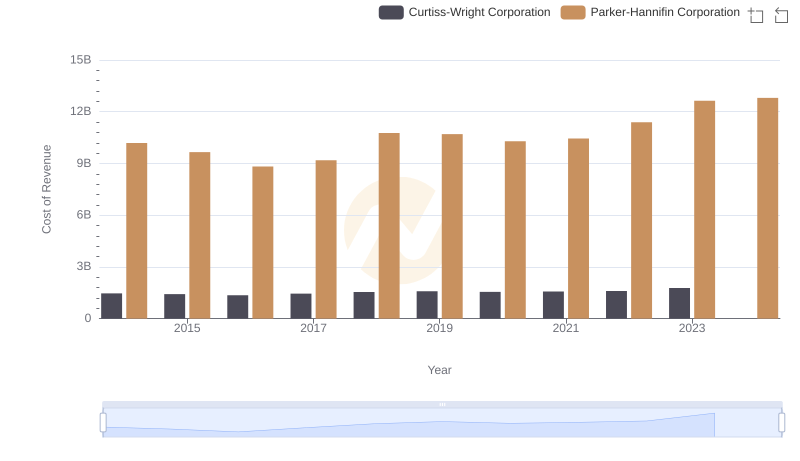
Analyzing Cost of Revenue: Parker-Hannifin Corporation and Curtiss-Wright Corporation
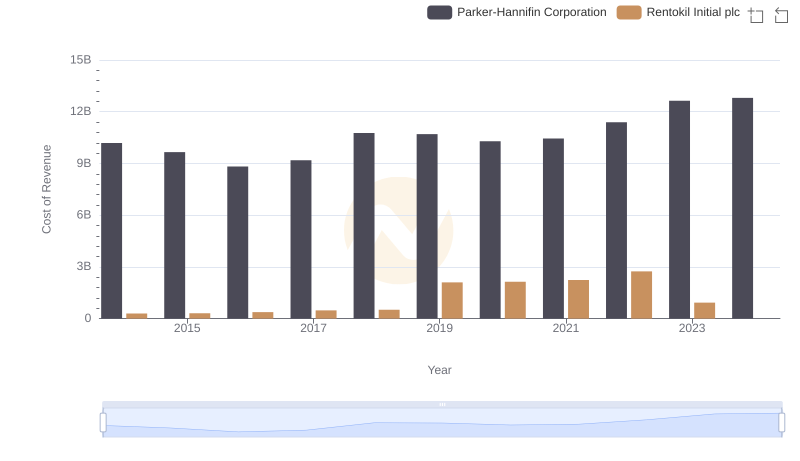
Analyzing Cost of Revenue: Parker-Hannifin Corporation and Rentokil Initial plc
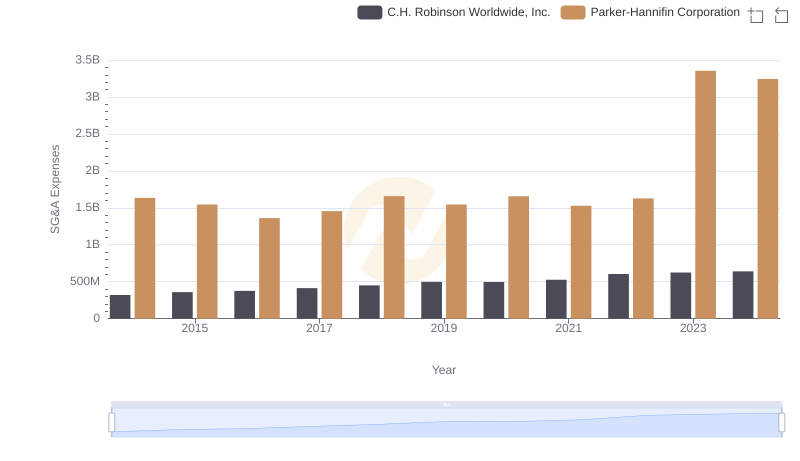
Parker-Hannifin Corporation and C.H. Robinson Worldwide, Inc.: SG&A Spending Patterns Compared
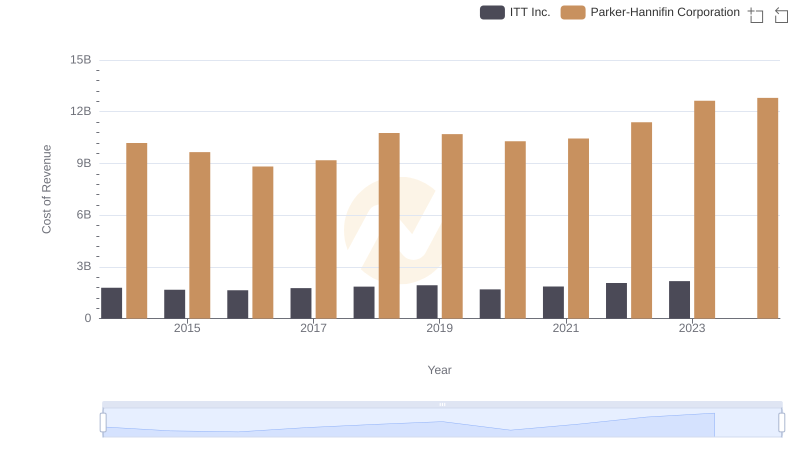
Cost of Revenue Trends: Parker-Hannifin Corporation vs ITT Inc.
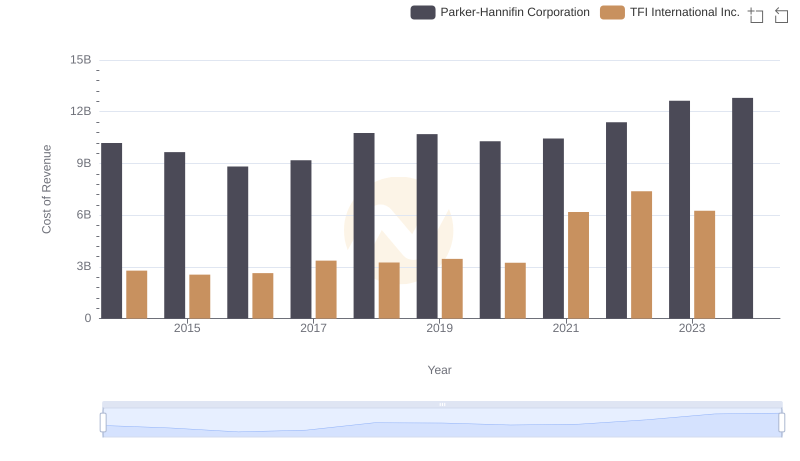
Cost of Revenue: Key Insights for Parker-Hannifin Corporation and TFI International Inc.
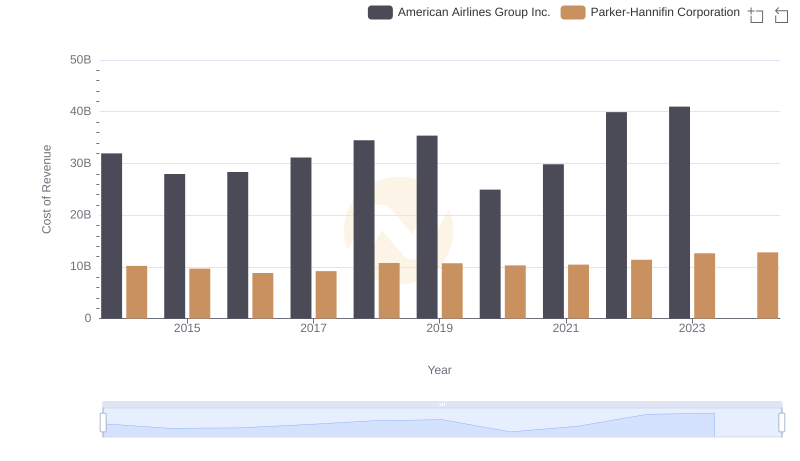
Analyzing Cost of Revenue: Parker-Hannifin Corporation and American Airlines Group Inc.
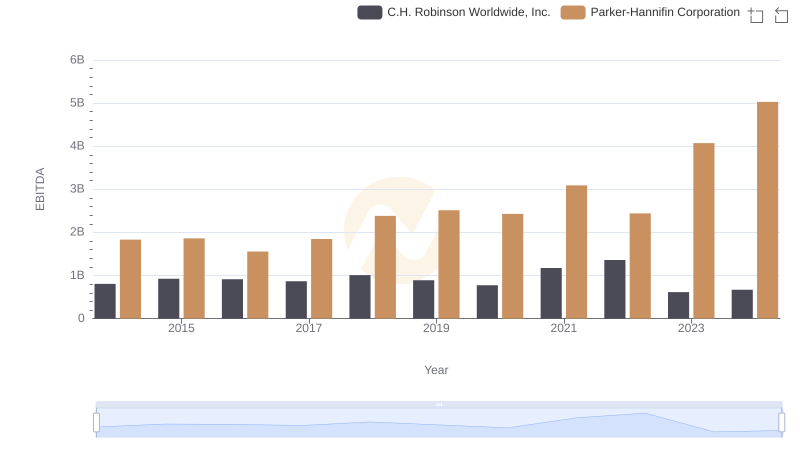
A Side-by-Side Analysis of EBITDA: Parker-Hannifin Corporation and C.H. Robinson Worldwide, Inc.