| __timestamp | Allegion plc | Parker-Hannifin Corporation |
|---|---|---|
| Wednesday, January 1, 2014 | 1264600000 | 10188227000 |
| Thursday, January 1, 2015 | 1199000000 | 9655245000 |
| Friday, January 1, 2016 | 1252700000 | 8823384000 |
| Sunday, January 1, 2017 | 1337500000 | 9188962000 |
| Monday, January 1, 2018 | 1558400000 | 10762841000 |
| Tuesday, January 1, 2019 | 1601700000 | 10703484000 |
| Wednesday, January 1, 2020 | 1541100000 | 10286518000 |
| Friday, January 1, 2021 | 1662500000 | 10449680000 |
| Saturday, January 1, 2022 | 1949500000 | 11387267000 |
| Sunday, January 1, 2023 | 2069300000 | 12635892000 |
| Monday, January 1, 2024 | 2103700000 | 12801816000 |
Unleashing the power of data
In the competitive landscape of industrial manufacturing, Parker-Hannifin Corporation and Allegion plc stand as titans. Over the past decade, Parker-Hannifin has consistently outpaced Allegion in terms of cost of revenue, with figures reaching nearly 10 times higher. From 2014 to 2023, Parker-Hannifin's cost of revenue grew by approximately 24%, peaking at $12.6 billion in 2023. In contrast, Allegion's cost of revenue increased by about 65% during the same period, reaching $2.1 billion. This growth trajectory highlights Allegion's aggressive expansion strategy, despite its smaller scale. The data for 2024 is incomplete, but Parker-Hannifin's upward trend suggests continued dominance. This comparison not only underscores the scale of operations but also reflects strategic differences in managing production costs. As these companies evolve, their financial strategies will be pivotal in shaping their future market positions.
Understanding these trends is crucial for investors seeking to navigate the industrial sector's dynamic landscape.
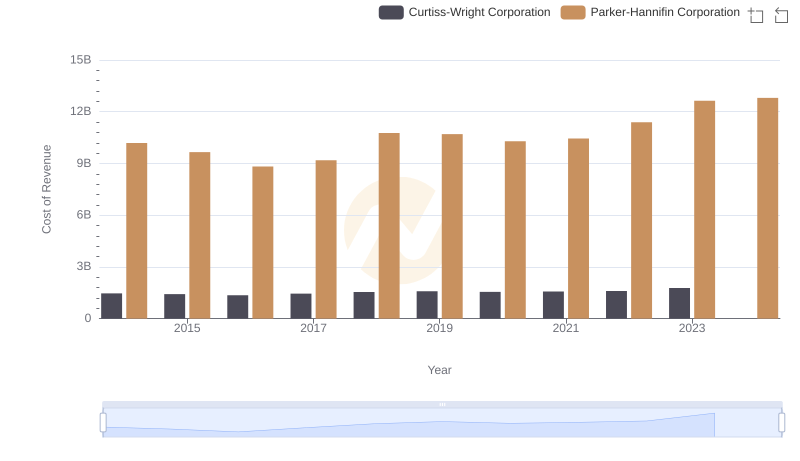
Analyzing Cost of Revenue: Parker-Hannifin Corporation and Curtiss-Wright Corporation
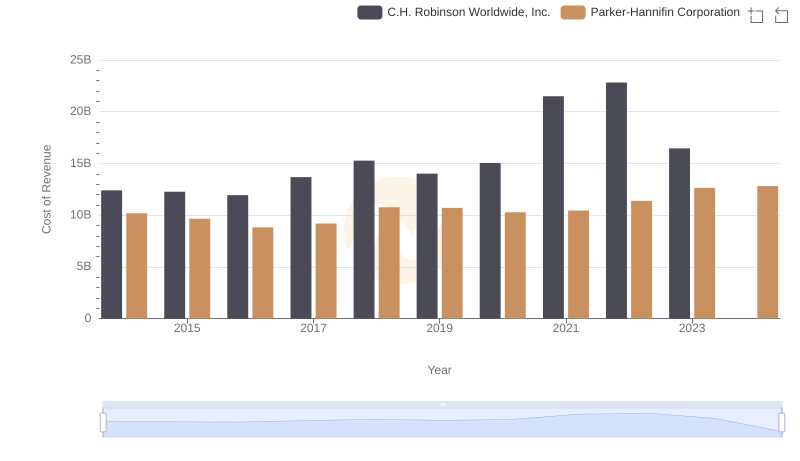
Cost of Revenue Trends: Parker-Hannifin Corporation vs C.H. Robinson Worldwide, Inc.
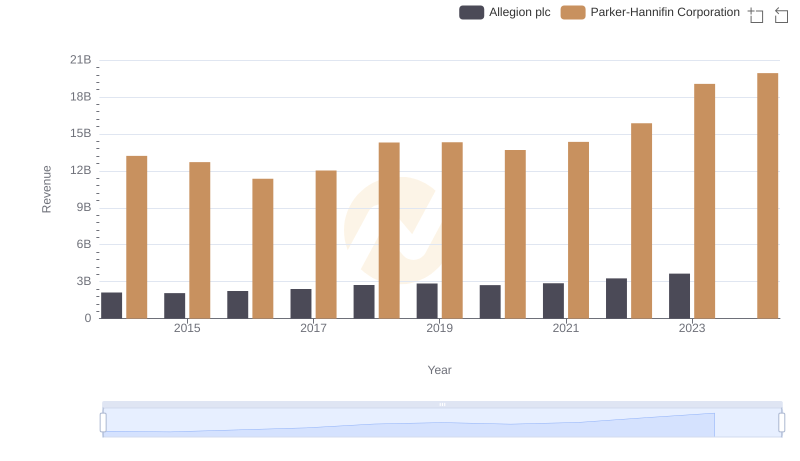
Breaking Down Revenue Trends: Parker-Hannifin Corporation vs Allegion plc
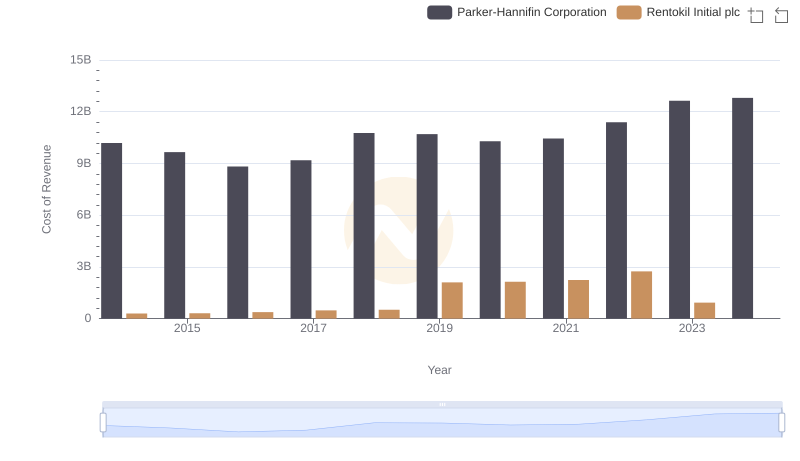
Analyzing Cost of Revenue: Parker-Hannifin Corporation and Rentokil Initial plc
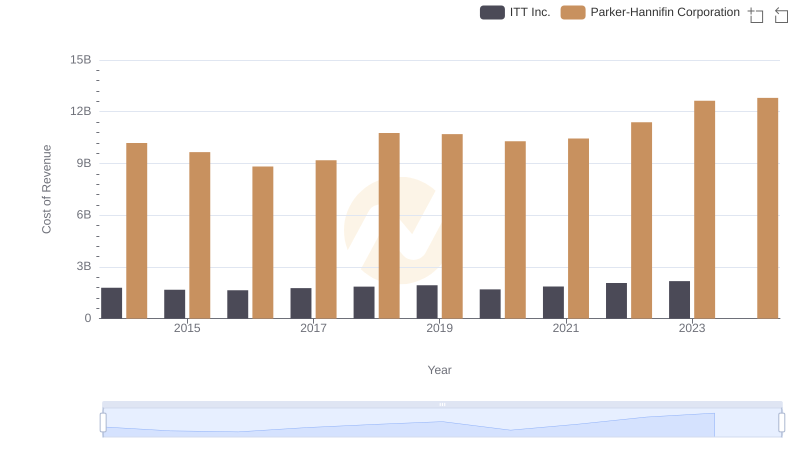
Cost of Revenue Trends: Parker-Hannifin Corporation vs ITT Inc.
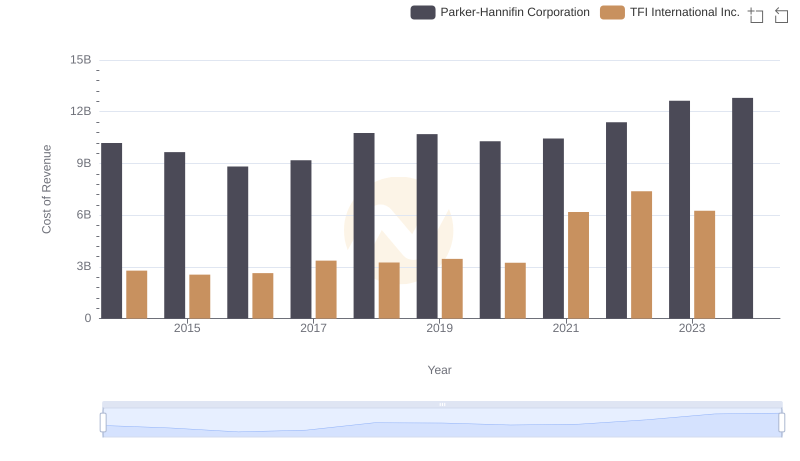
Cost of Revenue: Key Insights for Parker-Hannifin Corporation and TFI International Inc.
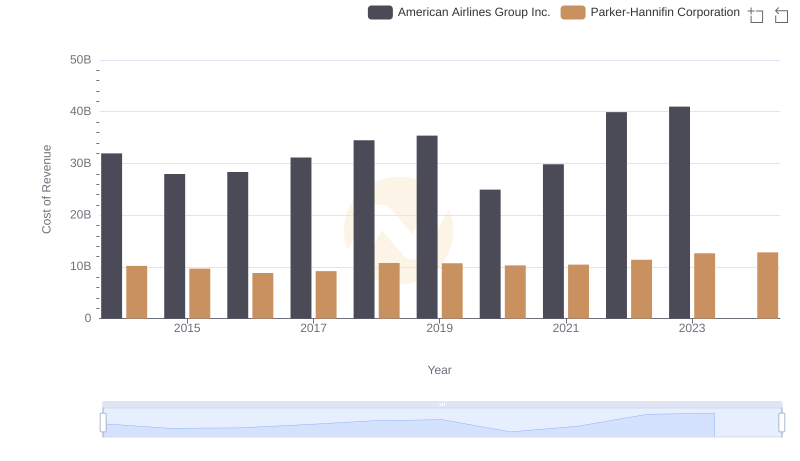
Analyzing Cost of Revenue: Parker-Hannifin Corporation and American Airlines Group Inc.
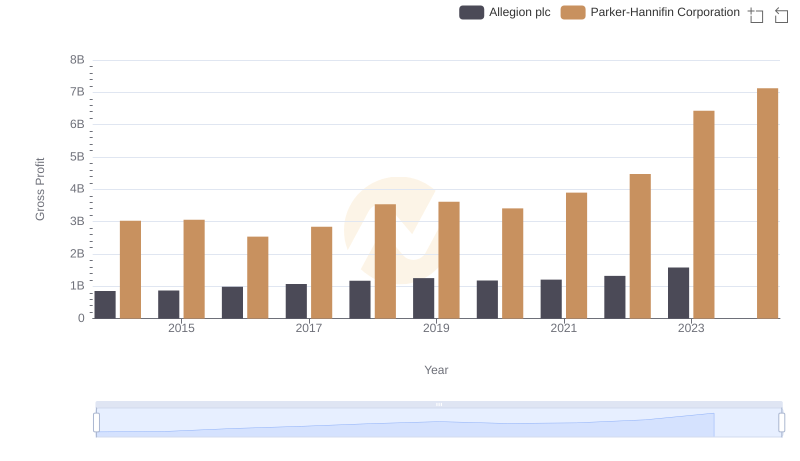
Who Generates Higher Gross Profit? Parker-Hannifin Corporation or Allegion plc
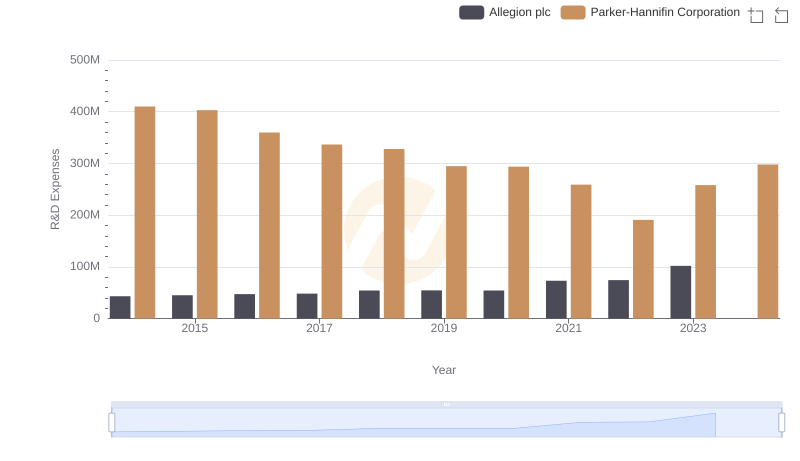
Research and Development Investment: Parker-Hannifin Corporation vs Allegion plc