| __timestamp | ITT Inc. | Parker-Hannifin Corporation |
|---|---|---|
| Wednesday, January 1, 2014 | 1788200000 | 10188227000 |
| Thursday, January 1, 2015 | 1676500000 | 9655245000 |
| Friday, January 1, 2016 | 1647200000 | 8823384000 |
| Sunday, January 1, 2017 | 1768100000 | 9188962000 |
| Monday, January 1, 2018 | 1857900000 | 10762841000 |
| Tuesday, January 1, 2019 | 1936300000 | 10703484000 |
| Wednesday, January 1, 2020 | 1695600000 | 10286518000 |
| Friday, January 1, 2021 | 1865500000 | 10449680000 |
| Saturday, January 1, 2022 | 2065400000 | 11387267000 |
| Sunday, January 1, 2023 | 2175700000 | 12635892000 |
| Monday, January 1, 2024 | 2383400000 | 12801816000 |
Unleashing the power of data
In the competitive landscape of industrial manufacturing, Parker-Hannifin Corporation and ITT Inc. have been pivotal players. Over the past decade, Parker-Hannifin has consistently outpaced ITT Inc. in terms of cost of revenue, showcasing a robust growth trajectory. From 2014 to 2023, Parker-Hannifin's cost of revenue surged by approximately 24%, reaching a peak in 2023. In contrast, ITT Inc. experienced a more modest increase of around 22% over the same period. Notably, Parker-Hannifin's cost of revenue in 2023 was nearly six times that of ITT Inc., highlighting its expansive operations and market reach. However, the data for 2024 is incomplete, leaving room for speculation on future trends. This analysis underscores the dynamic nature of the industrial sector and the strategic maneuvers of these corporations to maintain their competitive edge.
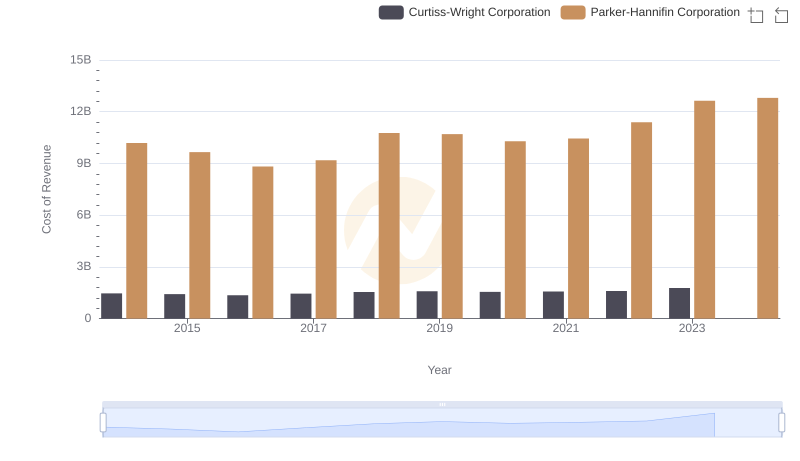
Analyzing Cost of Revenue: Parker-Hannifin Corporation and Curtiss-Wright Corporation
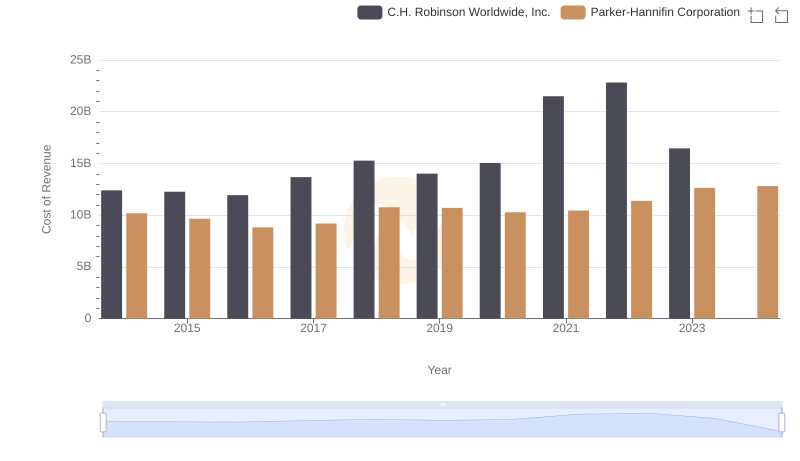
Cost of Revenue Trends: Parker-Hannifin Corporation vs C.H. Robinson Worldwide, Inc.
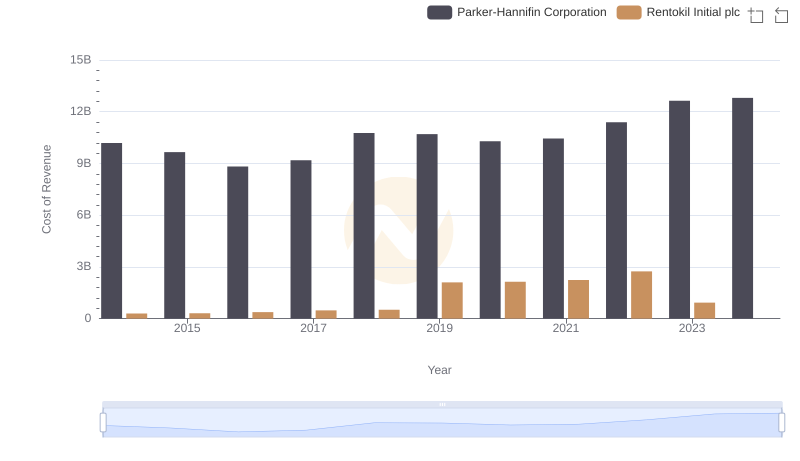
Analyzing Cost of Revenue: Parker-Hannifin Corporation and Rentokil Initial plc
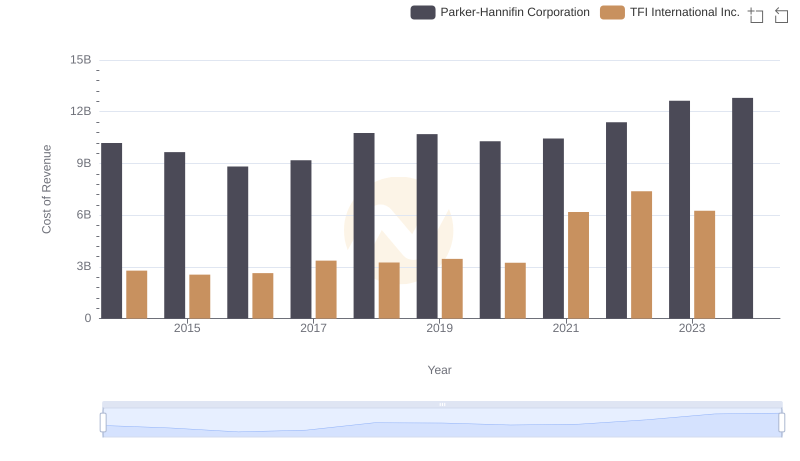
Cost of Revenue: Key Insights for Parker-Hannifin Corporation and TFI International Inc.
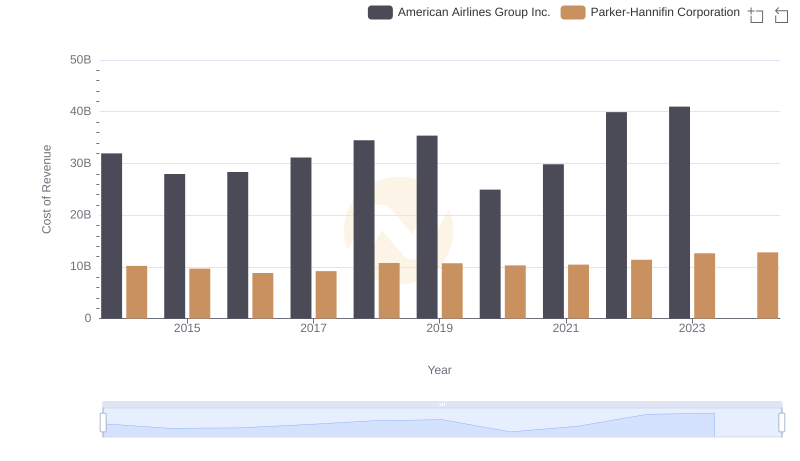
Analyzing Cost of Revenue: Parker-Hannifin Corporation and American Airlines Group Inc.
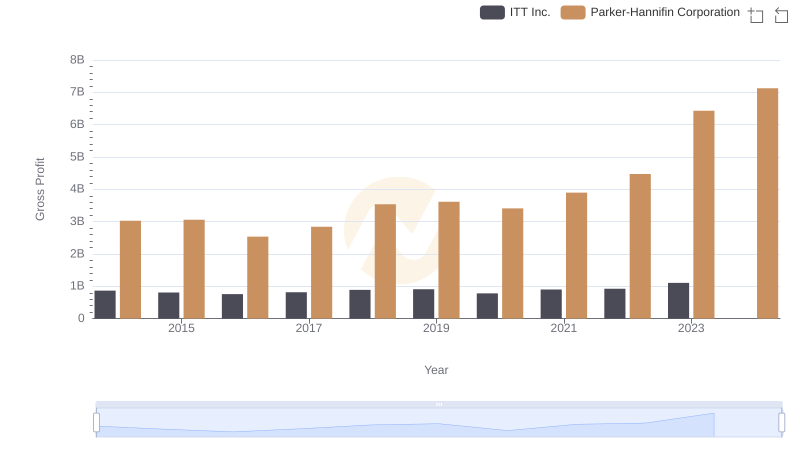
Key Insights on Gross Profit: Parker-Hannifin Corporation vs ITT Inc.
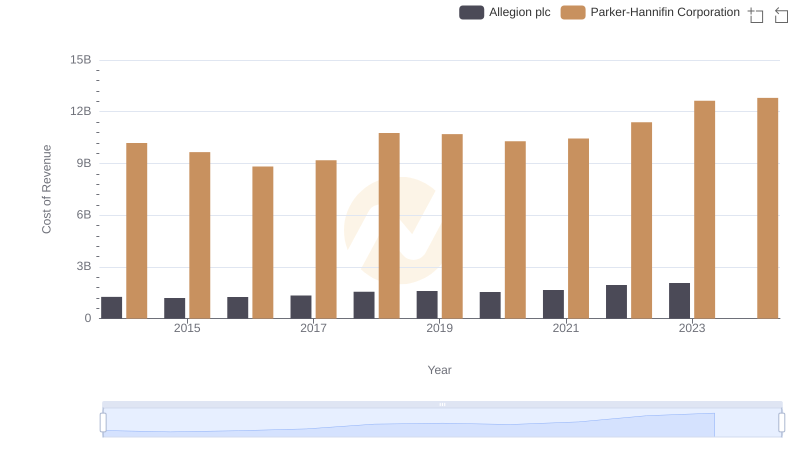
Cost of Revenue Comparison: Parker-Hannifin Corporation vs Allegion plc
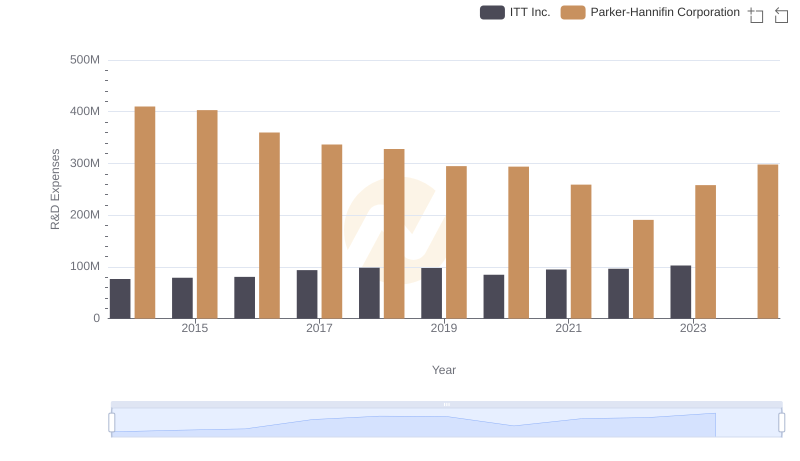
R&D Spending Showdown: Parker-Hannifin Corporation vs ITT Inc.
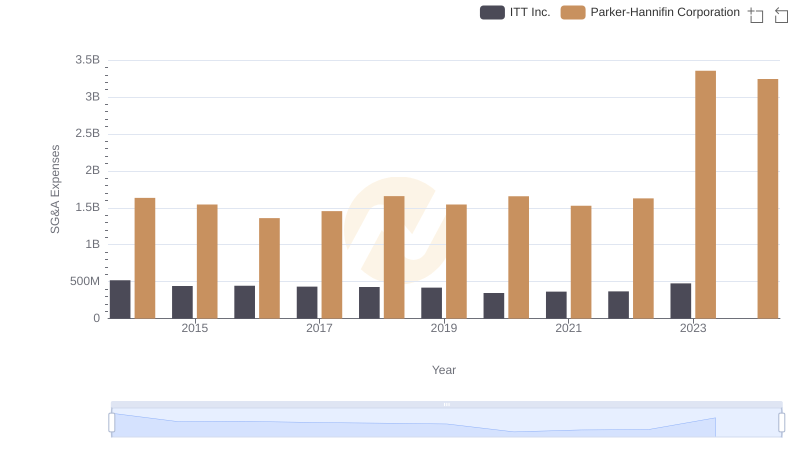
Parker-Hannifin Corporation or ITT Inc.: Who Manages SG&A Costs Better?
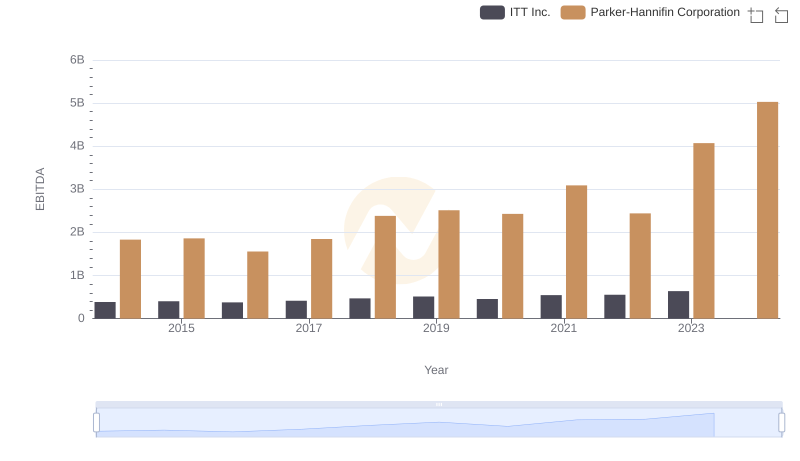
A Professional Review of EBITDA: Parker-Hannifin Corporation Compared to ITT Inc.