| __timestamp | Hewlett Packard Enterprise Company | International Business Machines Corporation |
|---|---|---|
| Wednesday, January 1, 2014 | 15637000000 | 46407000000 |
| Thursday, January 1, 2015 | 14939000000 | 40684000000 |
| Friday, January 1, 2016 | 14616000000 | 38516000000 |
| Sunday, January 1, 2017 | 8694000000 | 36943000000 |
| Monday, January 1, 2018 | 9292000000 | 36936000000 |
| Tuesday, January 1, 2019 | 9493000000 | 31533000000 |
| Wednesday, January 1, 2020 | 8469000000 | 30865000000 |
| Friday, January 1, 2021 | 9376000000 | 31486000000 |
| Saturday, January 1, 2022 | 9506000000 | 32687000000 |
| Sunday, January 1, 2023 | 10239000000 | 34300000000 |
| Monday, January 1, 2024 | 9844000000 | 35551000000 |
Unleashing the power of data
In the ever-evolving landscape of technology giants, International Business Machines Corporation (IBM) and Hewlett Packard Enterprise Company (HPE) have long been at the forefront. This analysis delves into their gross profit trends from 2014 to 2024, offering a glimpse into their financial trajectories.
IBM, a stalwart in the tech industry, consistently outperformed HPE in terms of gross profit. In 2014, IBM's gross profit was nearly three times that of HPE, highlighting its dominant market position. However, both companies experienced a downward trend over the decade, with IBM's gross profit decreasing by approximately 24% and HPE's by about 37%.
Despite these declines, IBM maintained a significant lead, ending 2024 with a gross profit of around $35.6 billion, compared to HPE's $9.8 billion. This data underscores IBM's resilience and HPE's challenges in maintaining profitability in a competitive market.
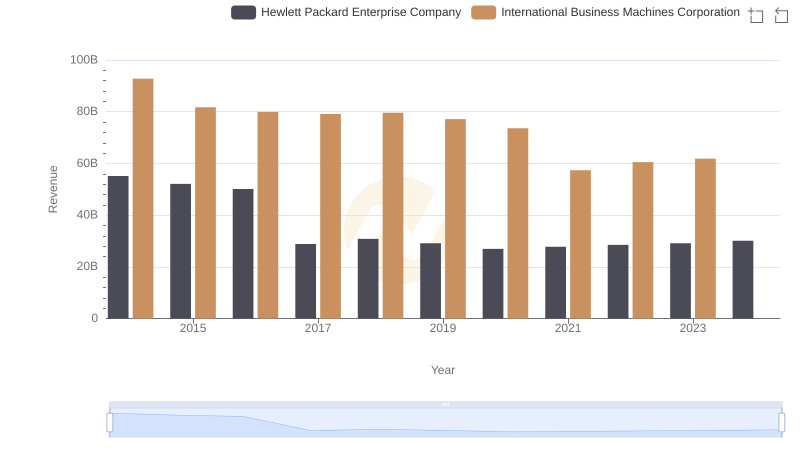
Who Generates More Revenue? International Business Machines Corporation or Hewlett Packard Enterprise Company
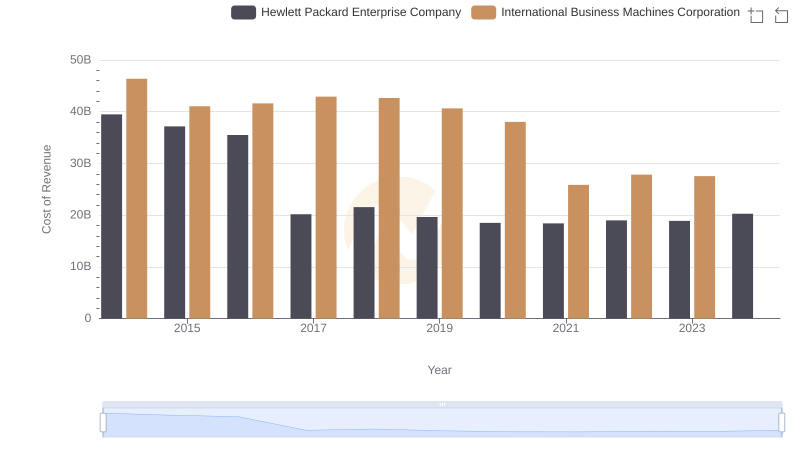
Analyzing Cost of Revenue: International Business Machines Corporation and Hewlett Packard Enterprise Company
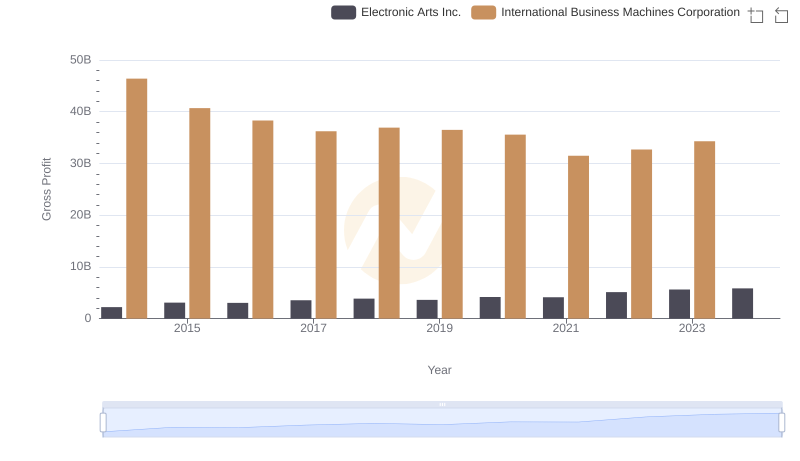
International Business Machines Corporation vs Electronic Arts Inc.: A Gross Profit Performance Breakdown
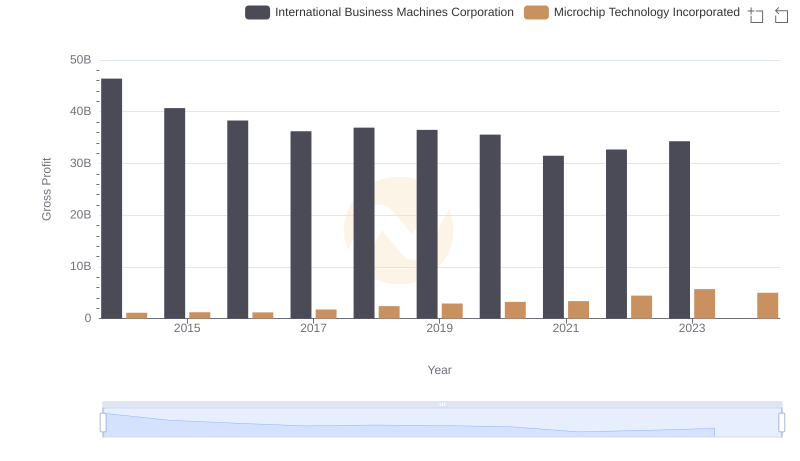
Gross Profit Analysis: Comparing International Business Machines Corporation and Microchip Technology Incorporated
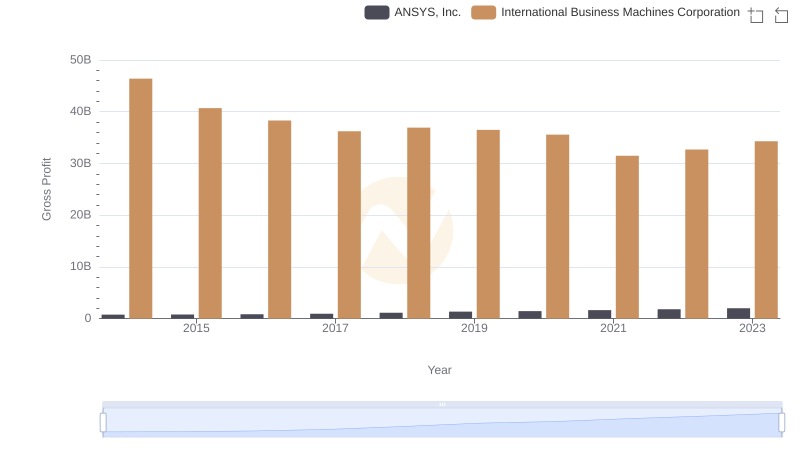
Gross Profit Comparison: International Business Machines Corporation and ANSYS, Inc. Trends
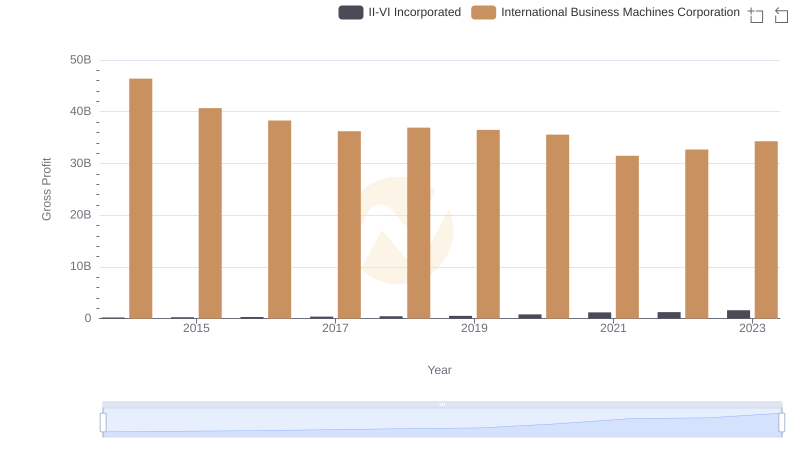
Gross Profit Trends Compared: International Business Machines Corporation vs II-VI Incorporated
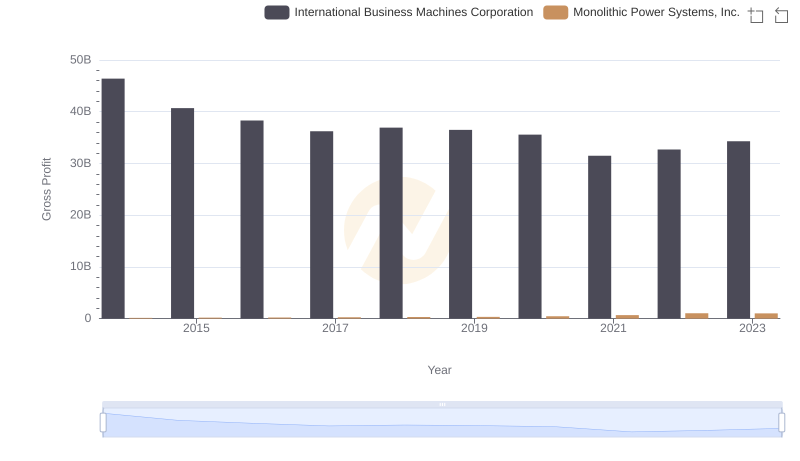
Key Insights on Gross Profit: International Business Machines Corporation vs Monolithic Power Systems, Inc.
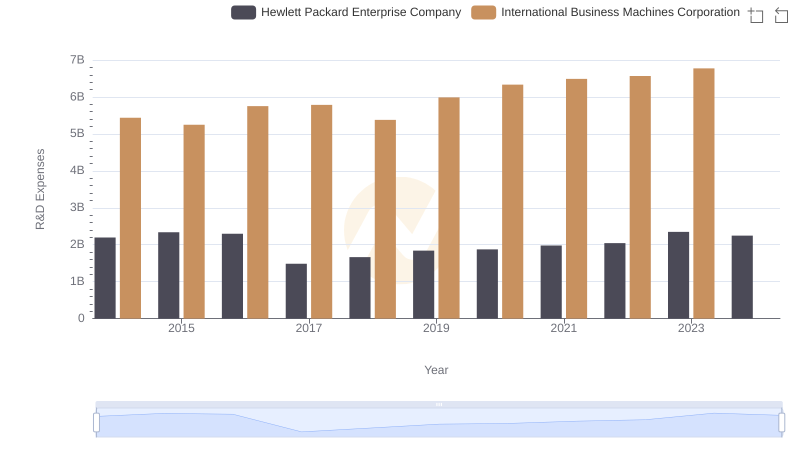
Research and Development Investment: International Business Machines Corporation vs Hewlett Packard Enterprise Company
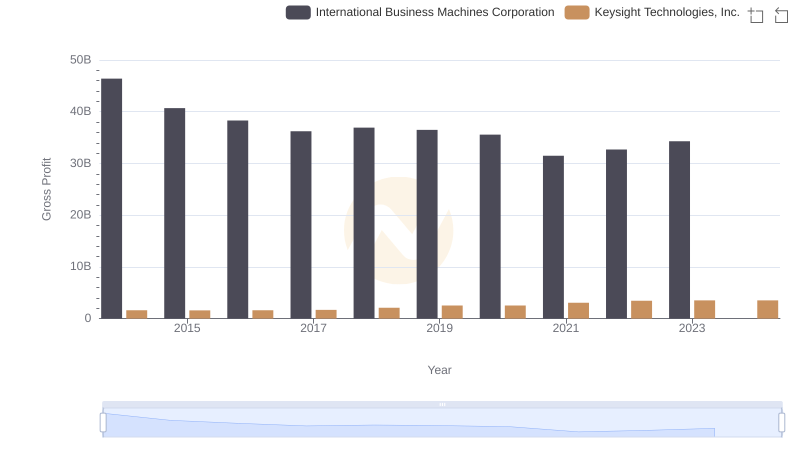
International Business Machines Corporation and Keysight Technologies, Inc.: A Detailed Gross Profit Analysis
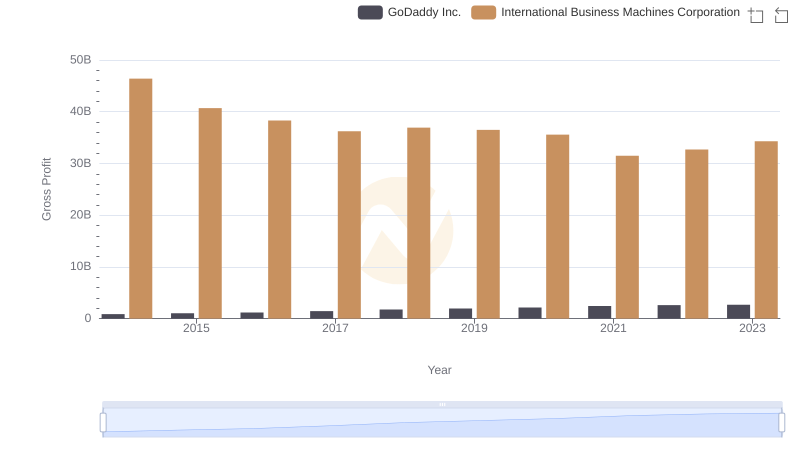
Gross Profit Comparison: International Business Machines Corporation and GoDaddy Inc. Trends
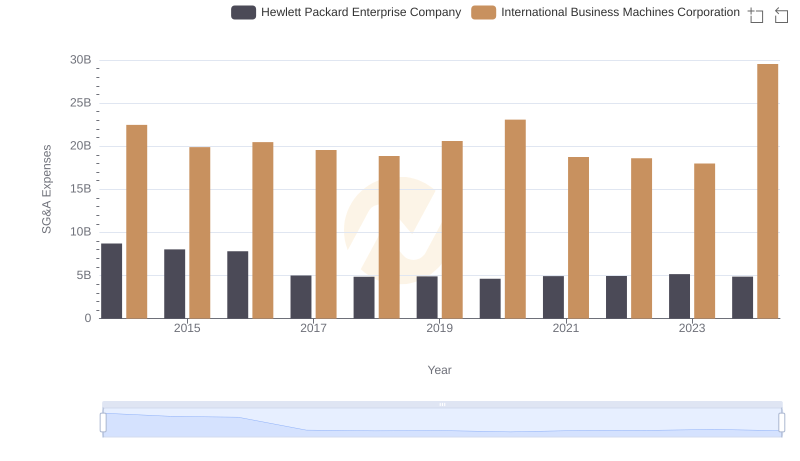
Comparing SG&A Expenses: International Business Machines Corporation vs Hewlett Packard Enterprise Company Trends and Insights
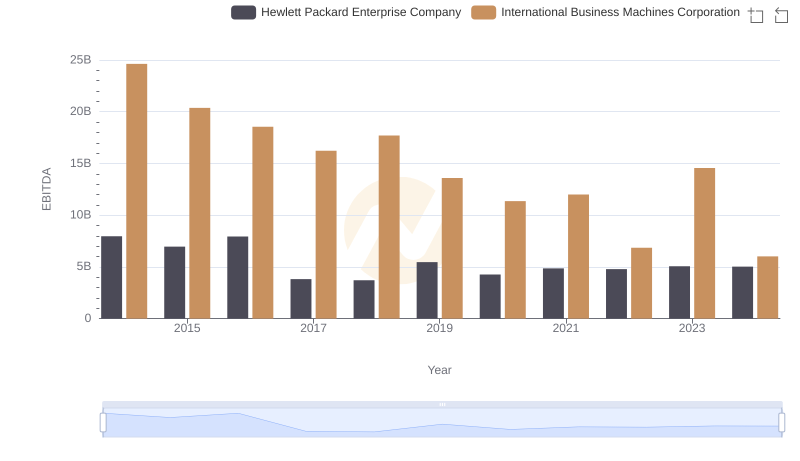
A Side-by-Side Analysis of EBITDA: International Business Machines Corporation and Hewlett Packard Enterprise Company