| __timestamp | Hewlett Packard Enterprise Company | International Business Machines Corporation |
|---|---|---|
| Wednesday, January 1, 2014 | 8717000000 | 22472000000 |
| Thursday, January 1, 2015 | 8025000000 | 19894000000 |
| Friday, January 1, 2016 | 7821000000 | 20279000000 |
| Sunday, January 1, 2017 | 5006000000 | 19680000000 |
| Monday, January 1, 2018 | 4851000000 | 19366000000 |
| Tuesday, January 1, 2019 | 4907000000 | 18724000000 |
| Wednesday, January 1, 2020 | 4624000000 | 20561000000 |
| Friday, January 1, 2021 | 4929000000 | 18745000000 |
| Saturday, January 1, 2022 | 4941000000 | 17483000000 |
| Sunday, January 1, 2023 | 5160000000 | 17997000000 |
| Monday, January 1, 2024 | 4871000000 | 29536000000 |
Unlocking the unknown
In the ever-evolving landscape of technology giants, the Selling, General, and Administrative (SG&A) expenses of International Business Machines Corporation (IBM) and Hewlett Packard Enterprise Company (HPE) offer a fascinating glimpse into their operational strategies over the past decade. From 2014 to 2024, IBM consistently outpaced HPE in SG&A spending, with IBM's expenses peaking at nearly 30% higher than HPE's in 2024. This trend underscores IBM's commitment to maintaining a robust administrative and sales infrastructure, even as the tech industry faces rapid changes.
HPE, on the other hand, demonstrated a more conservative approach, reducing its SG&A expenses by approximately 44% from 2014 to 2024. This strategic shift reflects HPE's focus on streamlining operations and optimizing costs. As we look to the future, these trends highlight the contrasting strategies of two tech titans navigating the complexities of a dynamic market.
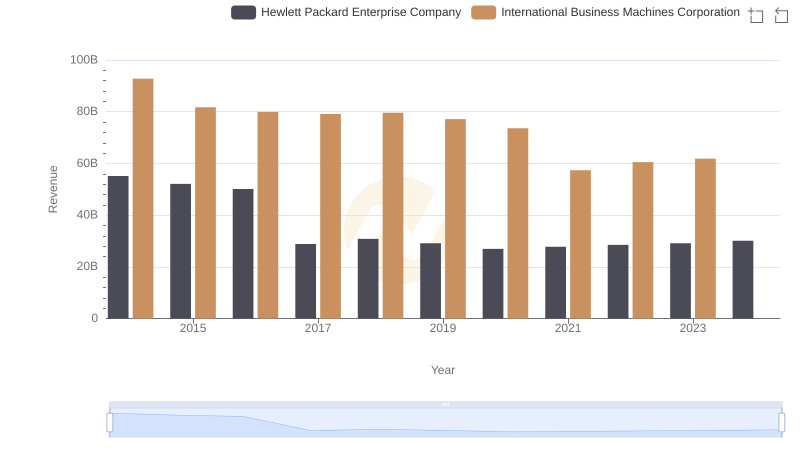
Who Generates More Revenue? International Business Machines Corporation or Hewlett Packard Enterprise Company
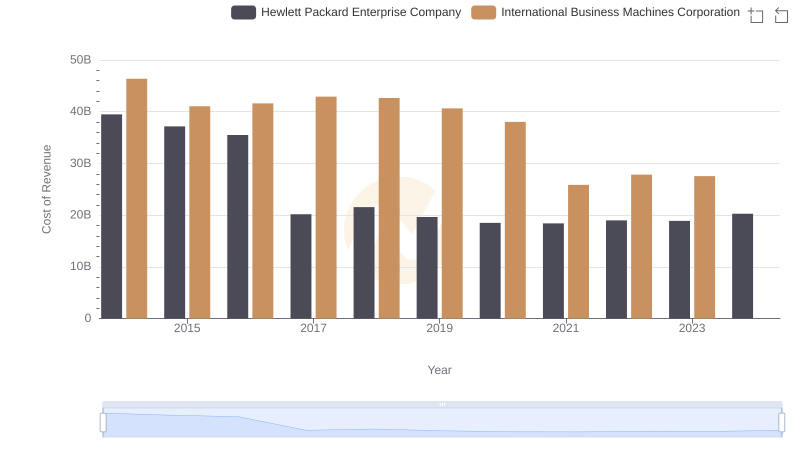
Analyzing Cost of Revenue: International Business Machines Corporation and Hewlett Packard Enterprise Company
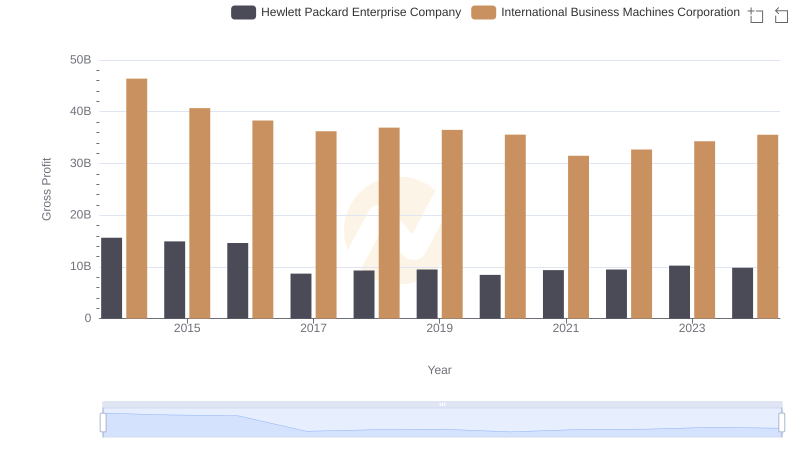
Gross Profit Analysis: Comparing International Business Machines Corporation and Hewlett Packard Enterprise Company
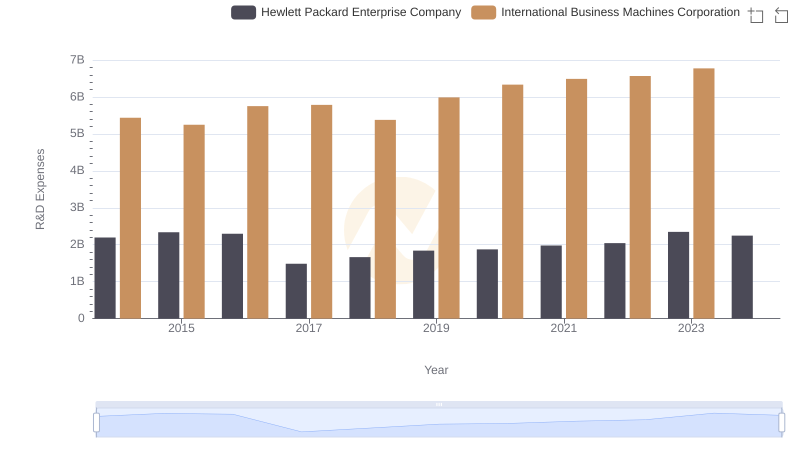
Research and Development Investment: International Business Machines Corporation vs Hewlett Packard Enterprise Company
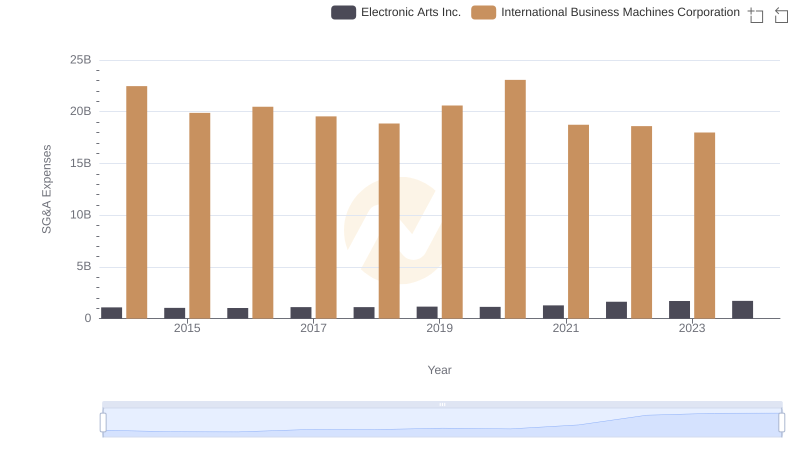
International Business Machines Corporation or Electronic Arts Inc.: Who Manages SG&A Costs Better?
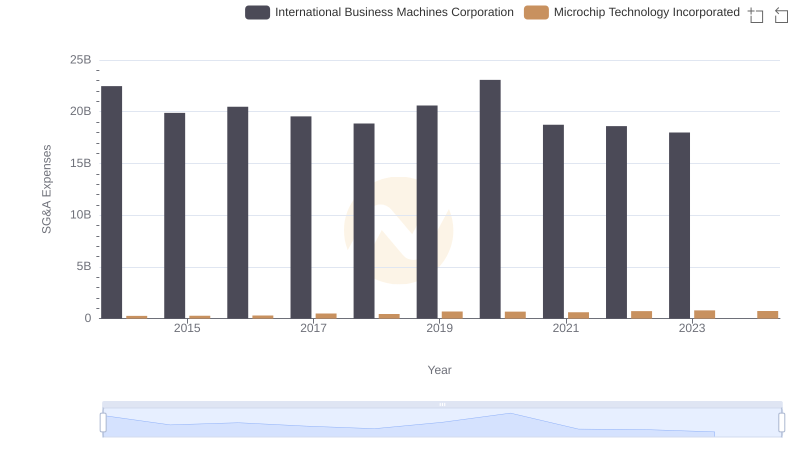
Operational Costs Compared: SG&A Analysis of International Business Machines Corporation and Microchip Technology Incorporated
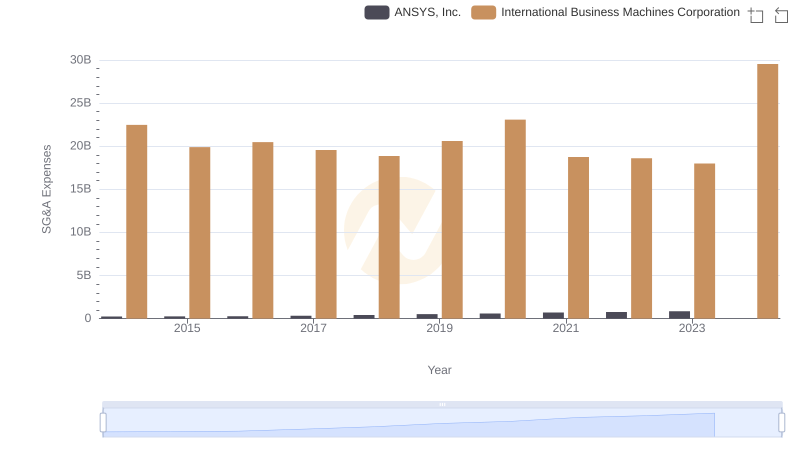
Comparing SG&A Expenses: International Business Machines Corporation vs ANSYS, Inc. Trends and Insights
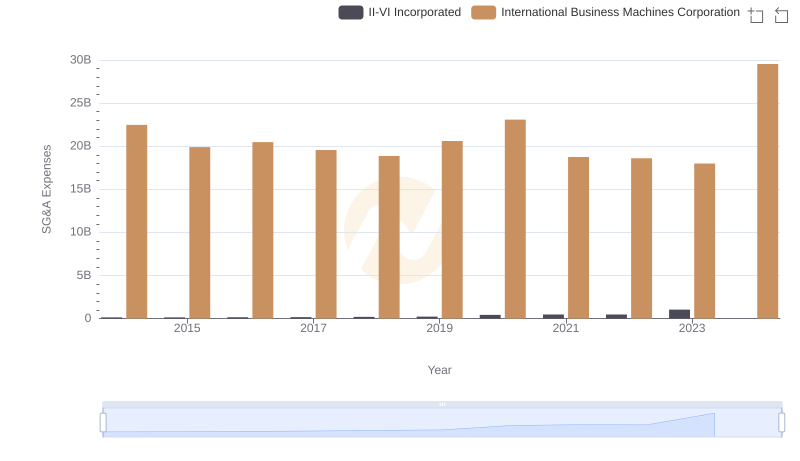
SG&A Efficiency Analysis: Comparing International Business Machines Corporation and II-VI Incorporated
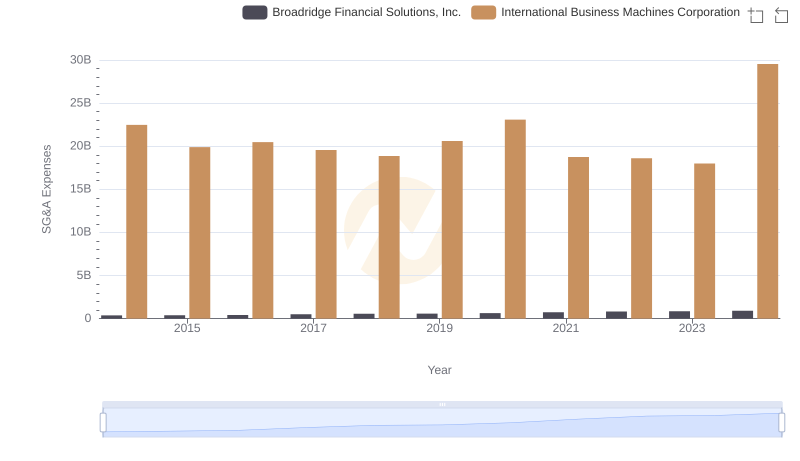
Operational Costs Compared: SG&A Analysis of International Business Machines Corporation and Broadridge Financial Solutions, Inc.
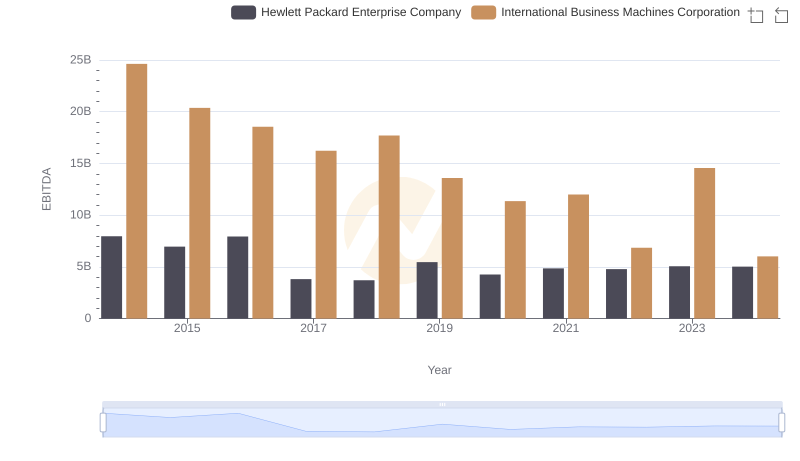
A Side-by-Side Analysis of EBITDA: International Business Machines Corporation and Hewlett Packard Enterprise Company
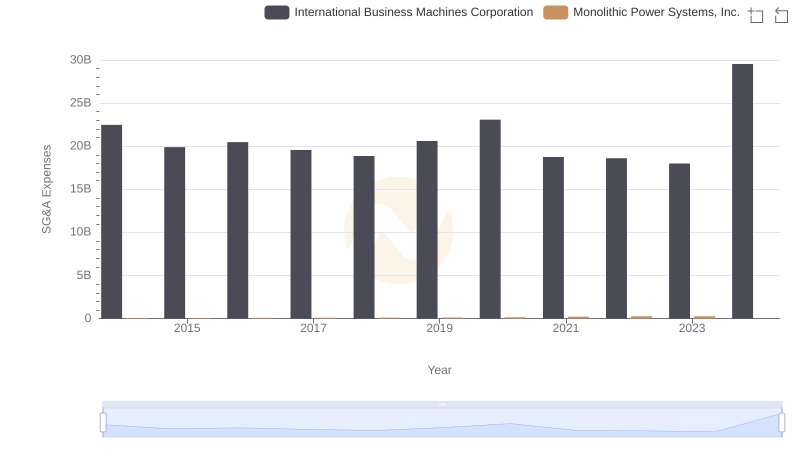
SG&A Efficiency Analysis: Comparing International Business Machines Corporation and Monolithic Power Systems, Inc.
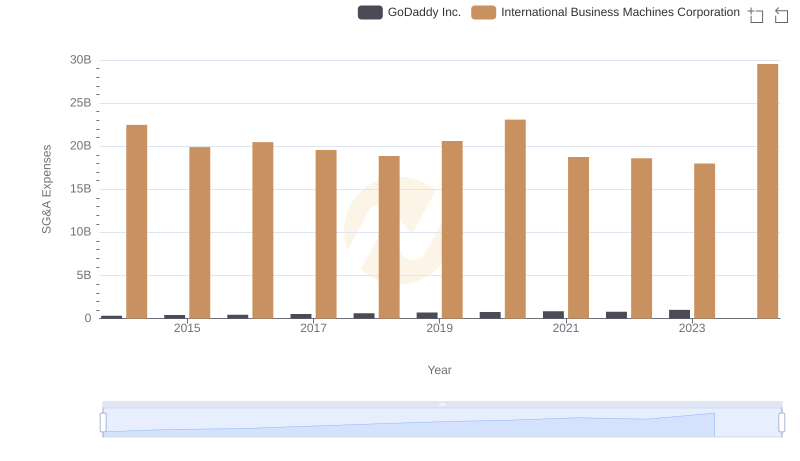
Cost Management Insights: SG&A Expenses for International Business Machines Corporation and GoDaddy Inc.