| __timestamp | AerCap Holdings N.V. | Ingersoll Rand Inc. |
|---|---|---|
| Wednesday, January 1, 2014 | 2252878000 | 1633224000 |
| Thursday, January 1, 2015 | 3776407000 | 1347800000 |
| Friday, January 1, 2016 | 3465727000 | 1222705000 |
| Sunday, January 1, 2017 | 3377439000 | 1477500000 |
| Monday, January 1, 2018 | 3299635000 | 1677300000 |
| Tuesday, January 1, 2019 | 3259091000 | 1540200000 |
| Wednesday, January 1, 2020 | 3217133000 | 3296800000 |
| Friday, January 1, 2021 | 3287413000 | 3163900000 |
| Saturday, January 1, 2022 | 4805277000 | 3590700000 |
| Sunday, January 1, 2023 | 3237016000 | 3993900000 |
| Monday, January 1, 2024 | 0 |
Unveiling the hidden dimensions of data
In the ever-evolving landscape of industrial and aviation sectors, understanding cost dynamics is crucial. From 2014 to 2023, Ingersoll Rand Inc. and AerCap Holdings N.V. have shown distinct trends in their cost of revenue. AerCap Holdings, a leader in aircraft leasing, saw its cost of revenue peak in 2022, marking a 48% increase from its 2014 figures. Meanwhile, Ingersoll Rand, a stalwart in industrial manufacturing, experienced a significant surge in 2023, with costs rising by 145% compared to 2014. This divergence highlights the unique challenges and growth trajectories faced by these companies. While AerCap's costs have fluctuated, reflecting the volatile aviation market, Ingersoll Rand's steady rise underscores its expansion and adaptation in the industrial sector. These insights offer a window into the strategic maneuvers and market conditions influencing these industry giants.
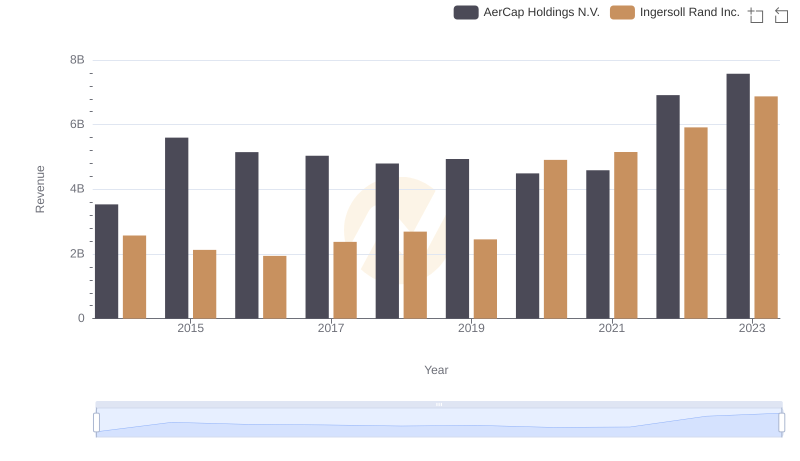
Revenue Insights: Ingersoll Rand Inc. and AerCap Holdings N.V. Performance Compared
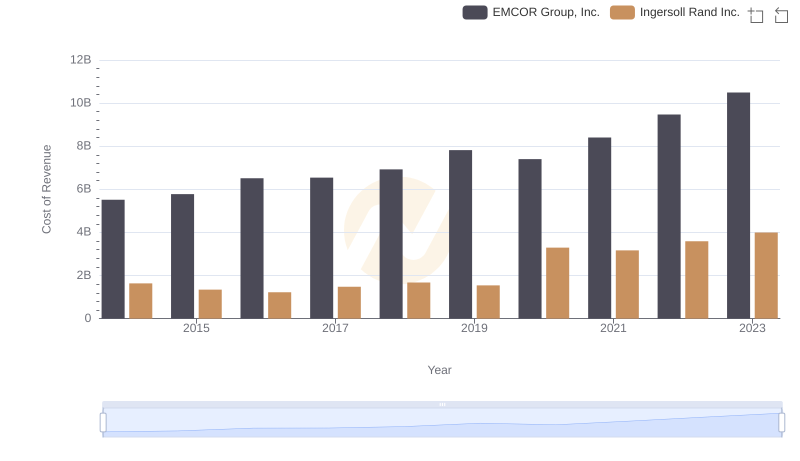
Comparing Cost of Revenue Efficiency: Ingersoll Rand Inc. vs EMCOR Group, Inc.
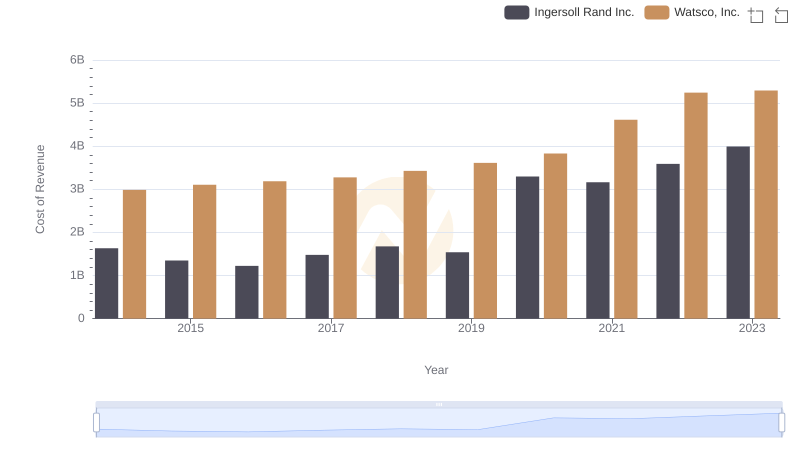
Cost of Revenue: Key Insights for Ingersoll Rand Inc. and Watsco, Inc.
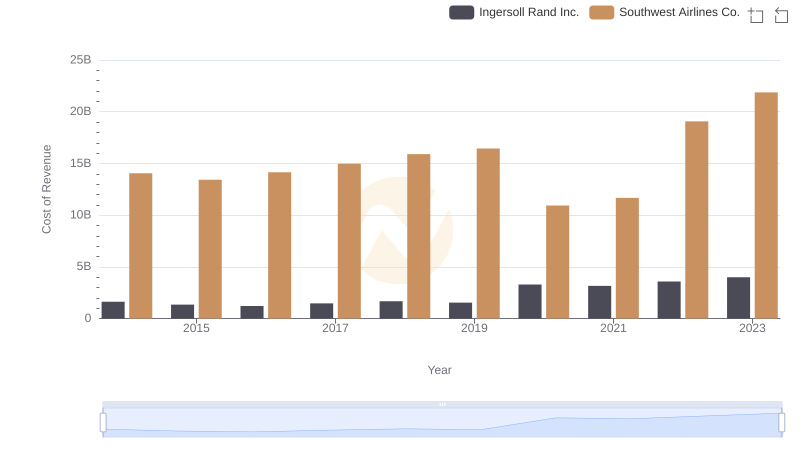
Cost of Revenue Trends: Ingersoll Rand Inc. vs Southwest Airlines Co.
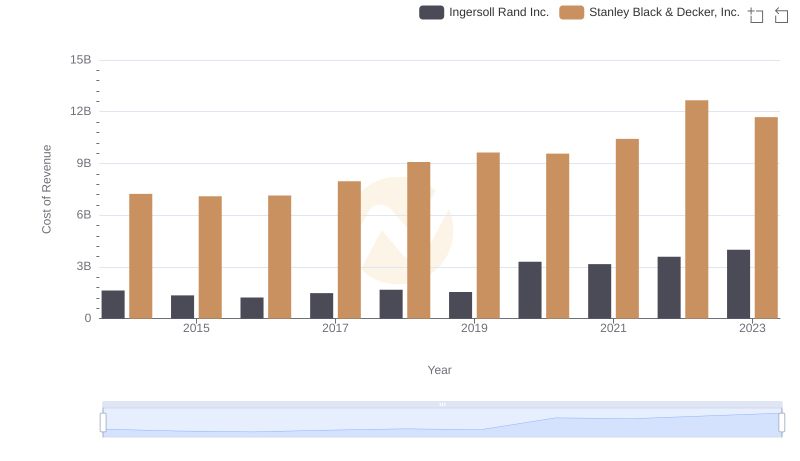
Cost of Revenue Trends: Ingersoll Rand Inc. vs Stanley Black & Decker, Inc.
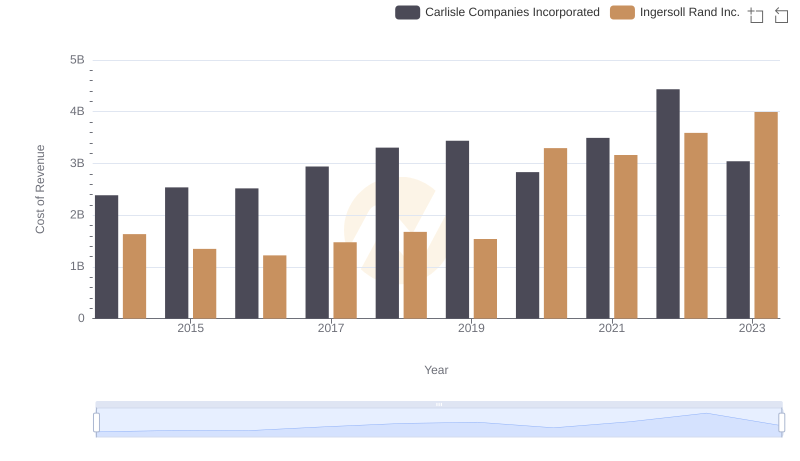
Cost of Revenue Trends: Ingersoll Rand Inc. vs Carlisle Companies Incorporated
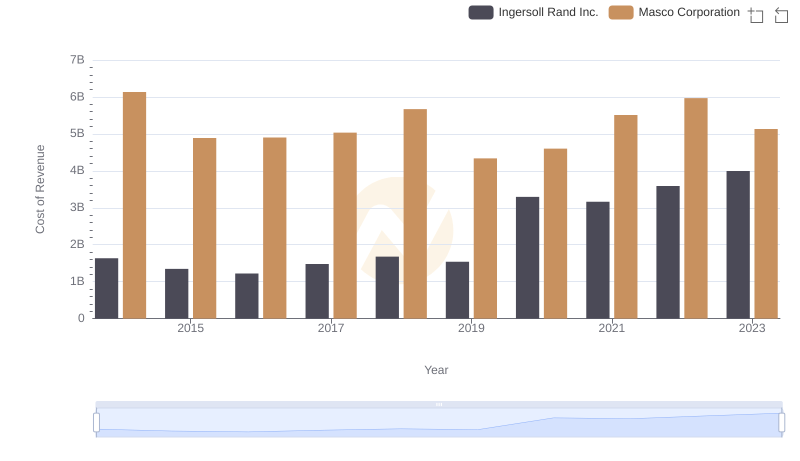
Cost of Revenue: Key Insights for Ingersoll Rand Inc. and Masco Corporation
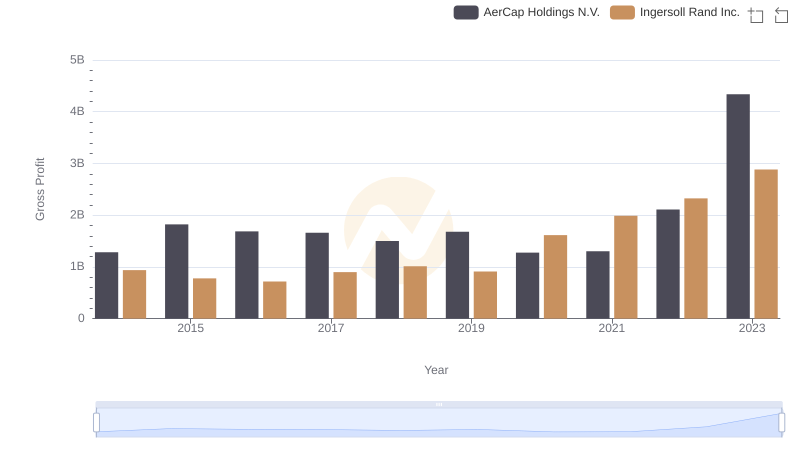
Gross Profit Comparison: Ingersoll Rand Inc. and AerCap Holdings N.V. Trends
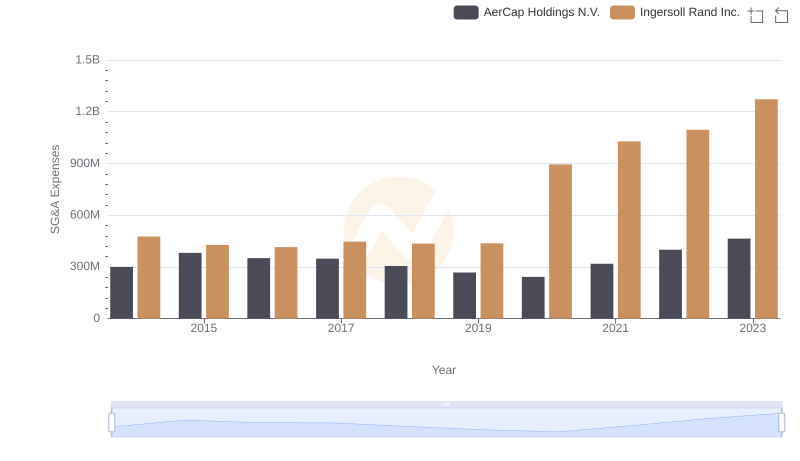
Breaking Down SG&A Expenses: Ingersoll Rand Inc. vs AerCap Holdings N.V.