| __timestamp | AerCap Holdings N.V. | Ingersoll Rand Inc. |
|---|---|---|
| Wednesday, January 1, 2014 | 299900000 | 476000000 |
| Thursday, January 1, 2015 | 381308000 | 427000000 |
| Friday, January 1, 2016 | 351012000 | 414339000 |
| Sunday, January 1, 2017 | 348291000 | 446600000 |
| Monday, January 1, 2018 | 305226000 | 434600000 |
| Tuesday, January 1, 2019 | 267458000 | 436400000 |
| Wednesday, January 1, 2020 | 242161000 | 894800000 |
| Friday, January 1, 2021 | 317888000 | 1028000000 |
| Saturday, January 1, 2022 | 399530000 | 1095800000 |
| Sunday, January 1, 2023 | 464128000 | 1272700000 |
| Monday, January 1, 2024 | 0 |
Infusing magic into the data realm
In the world of corporate finance, Selling, General, and Administrative (SG&A) expenses are a critical measure of a company's operational efficiency. Over the past decade, Ingersoll Rand Inc. and AerCap Holdings N.V. have showcased contrasting trends in their SG&A expenses. From 2014 to 2023, Ingersoll Rand's SG&A expenses surged by approximately 167%, peaking in 2023. This reflects a strategic expansion and investment in operational capabilities. In contrast, AerCap Holdings experienced a more modest increase of around 55% over the same period, indicating a more conservative approach to cost management.
The year 2020 marked a significant divergence, with Ingersoll Rand's expenses nearly doubling, while AerCap's remained relatively stable. This disparity highlights differing strategic priorities and market responses. As we look to the future, these trends offer valuable insights into the financial strategies of these industry leaders.
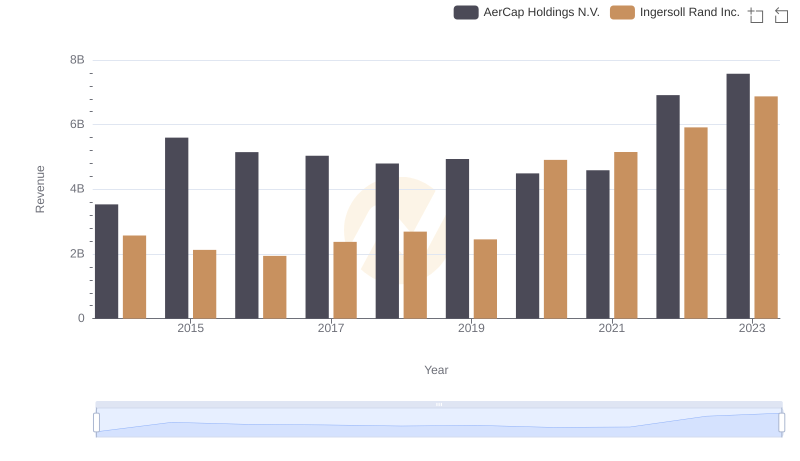
Revenue Insights: Ingersoll Rand Inc. and AerCap Holdings N.V. Performance Compared
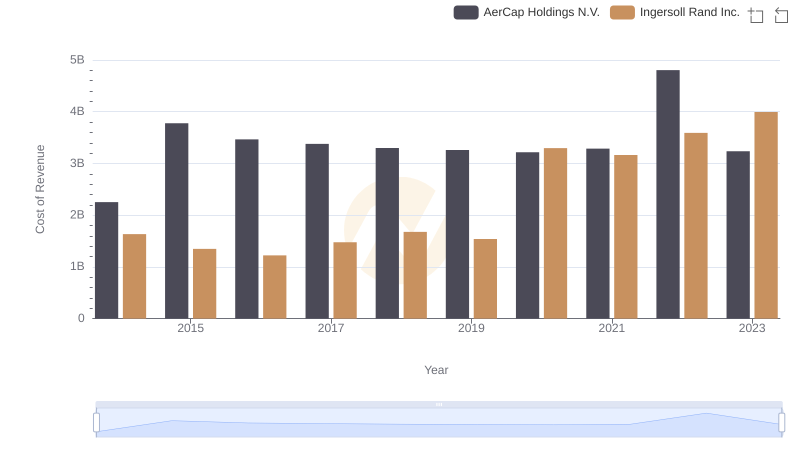
Analyzing Cost of Revenue: Ingersoll Rand Inc. and AerCap Holdings N.V.
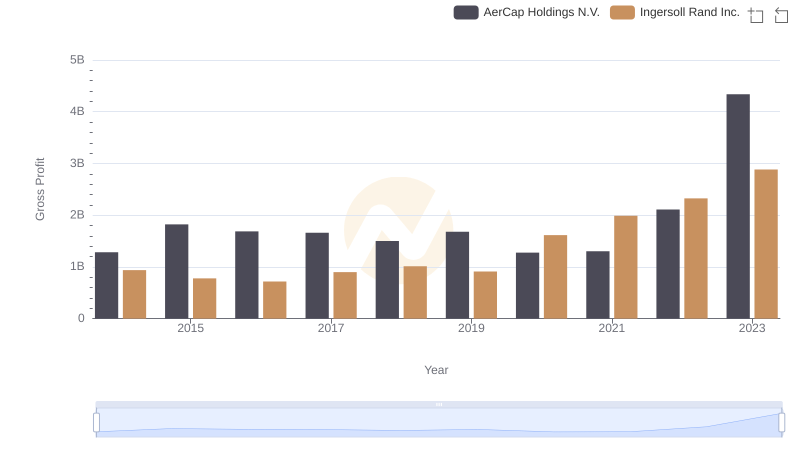
Gross Profit Comparison: Ingersoll Rand Inc. and AerCap Holdings N.V. Trends
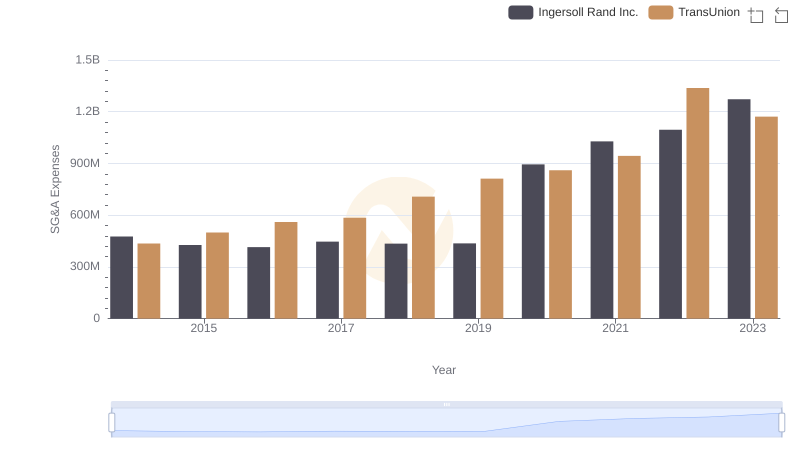
Comparing SG&A Expenses: Ingersoll Rand Inc. vs TransUnion Trends and Insights
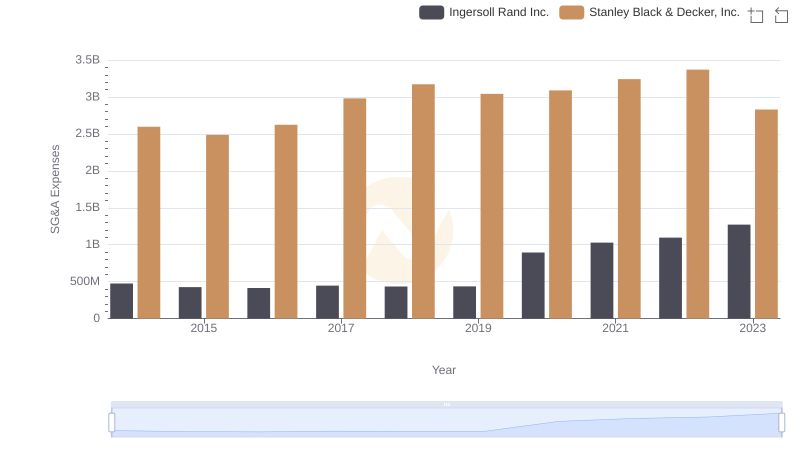
Who Optimizes SG&A Costs Better? Ingersoll Rand Inc. or Stanley Black & Decker, Inc.
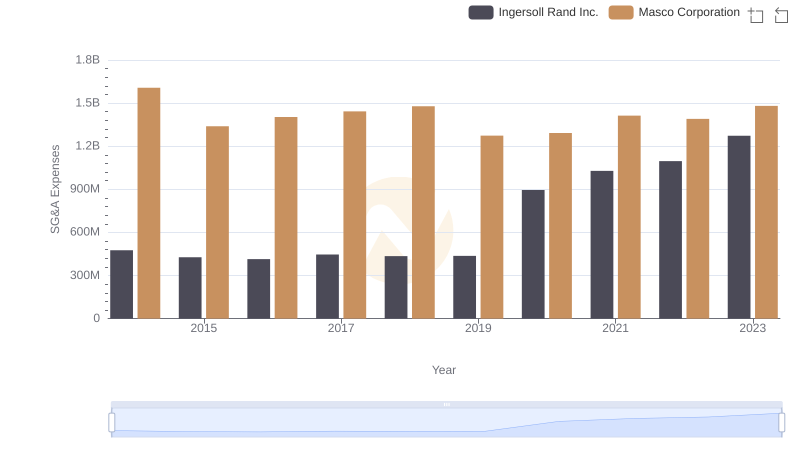
Ingersoll Rand Inc. or Masco Corporation: Who Manages SG&A Costs Better?
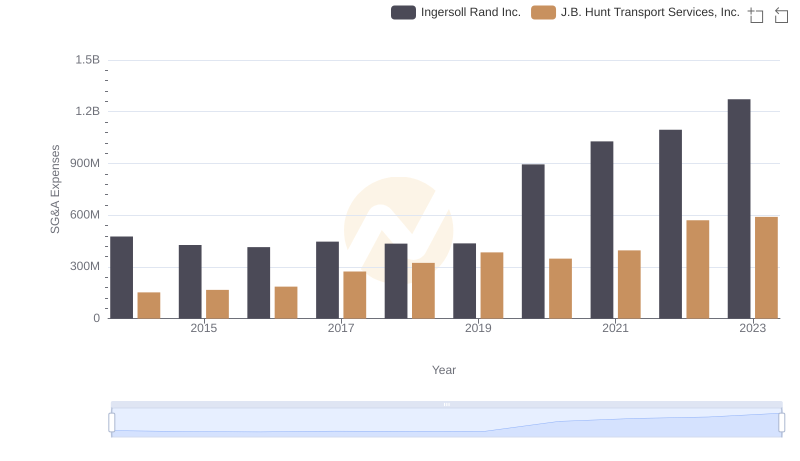
Ingersoll Rand Inc. or J.B. Hunt Transport Services, Inc.: Who Manages SG&A Costs Better?