| __timestamp | Carlisle Companies Incorporated | Ingersoll Rand Inc. |
|---|---|---|
| Wednesday, January 1, 2014 | 2384500000 | 1633224000 |
| Thursday, January 1, 2015 | 2536500000 | 1347800000 |
| Friday, January 1, 2016 | 2518100000 | 1222705000 |
| Sunday, January 1, 2017 | 2941900000 | 1477500000 |
| Monday, January 1, 2018 | 3304800000 | 1677300000 |
| Tuesday, January 1, 2019 | 3439900000 | 1540200000 |
| Wednesday, January 1, 2020 | 2832500000 | 3296800000 |
| Friday, January 1, 2021 | 3495600000 | 3163900000 |
| Saturday, January 1, 2022 | 4434500000 | 3590700000 |
| Sunday, January 1, 2023 | 3042900000 | 3993900000 |
| Monday, January 1, 2024 | 3115900000 | 0 |
Unveiling the hidden dimensions of data
In the ever-evolving landscape of industrial manufacturing, Ingersoll Rand Inc. and Carlisle Companies Incorporated have been pivotal players. Over the past decade, these companies have showcased intriguing trends in their cost of revenue, a critical metric reflecting the direct costs attributable to the production of goods sold by a company.
From 2014 to 2023, Carlisle Companies saw a steady increase in their cost of revenue, peaking in 2022 with a 44% rise from 2014. In contrast, Ingersoll Rand experienced a more volatile journey, with a significant spike in 2020, marking a 100% increase from 2019. By 2023, Ingersoll Rand's cost of revenue surpassed Carlisle's by approximately 31%, highlighting its aggressive growth strategy.
These trends underscore the dynamic nature of the industrial sector, where strategic decisions and market conditions can dramatically influence financial outcomes.
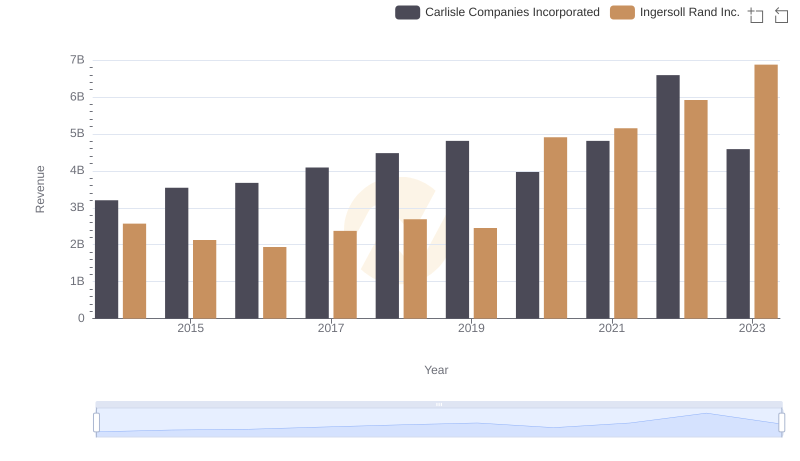
Ingersoll Rand Inc. vs Carlisle Companies Incorporated: Annual Revenue Growth Compared
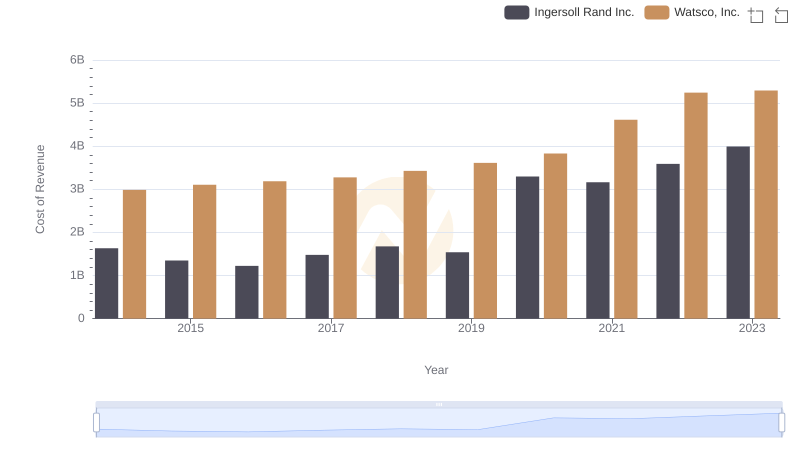
Cost of Revenue: Key Insights for Ingersoll Rand Inc. and Watsco, Inc.
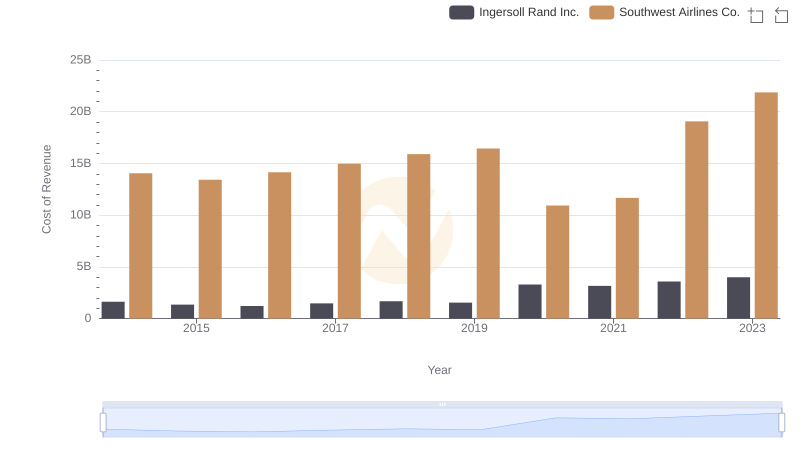
Cost of Revenue Trends: Ingersoll Rand Inc. vs Southwest Airlines Co.
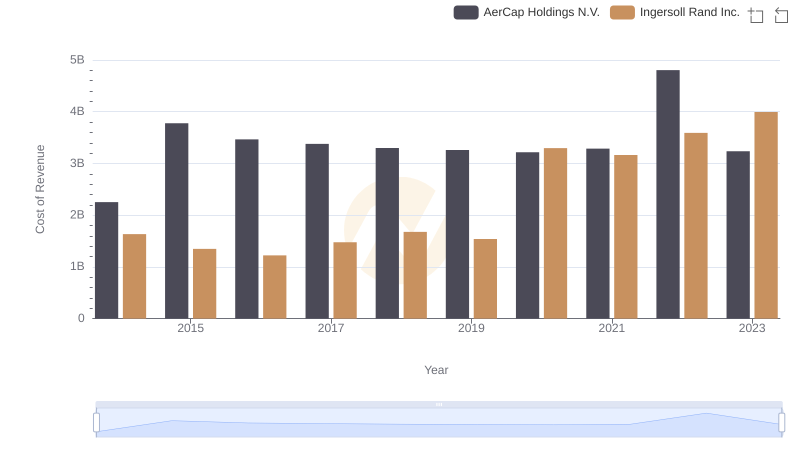
Analyzing Cost of Revenue: Ingersoll Rand Inc. and AerCap Holdings N.V.
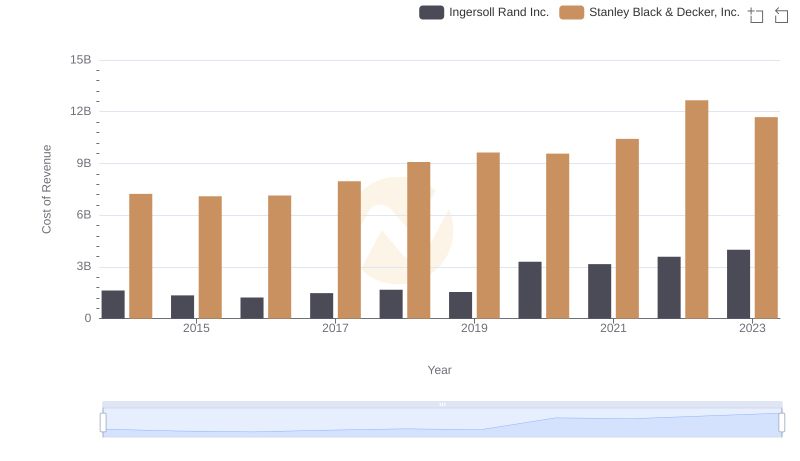
Cost of Revenue Trends: Ingersoll Rand Inc. vs Stanley Black & Decker, Inc.
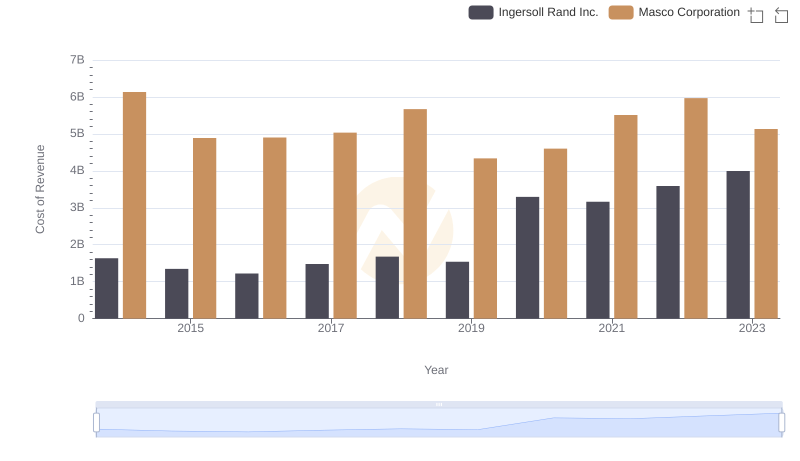
Cost of Revenue: Key Insights for Ingersoll Rand Inc. and Masco Corporation
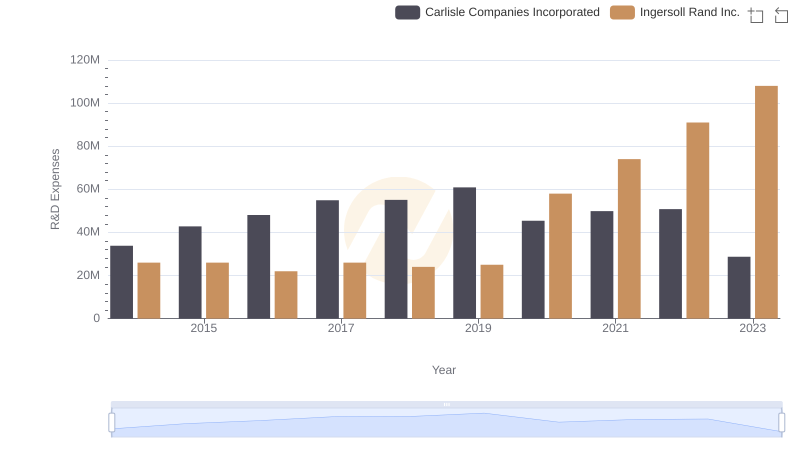
Research and Development: Comparing Key Metrics for Ingersoll Rand Inc. and Carlisle Companies Incorporated