| __timestamp | AerCap Holdings N.V. | Ingersoll Rand Inc. |
|---|---|---|
| Wednesday, January 1, 2014 | 1282919000 | 936781000 |
| Thursday, January 1, 2015 | 1822255000 | 779100000 |
| Friday, January 1, 2016 | 1686404000 | 716731000 |
| Sunday, January 1, 2017 | 1660054000 | 897900000 |
| Monday, January 1, 2018 | 1500345000 | 1012500000 |
| Tuesday, January 1, 2019 | 1678249000 | 911700000 |
| Wednesday, January 1, 2020 | 1276496000 | 1613400000 |
| Friday, January 1, 2021 | 1301517000 | 1988500000 |
| Saturday, January 1, 2022 | 2109708000 | 2325600000 |
| Sunday, January 1, 2023 | 4337648000 | 2882200000 |
| Monday, January 1, 2024 | 0 |
In pursuit of knowledge
In the ever-evolving landscape of industrial and aviation sectors, understanding financial trends is crucial. Over the past decade, Ingersoll Rand Inc. and AerCap Holdings N.V. have showcased intriguing gross profit trajectories. From 2014 to 2023, AerCap Holdings N.V. experienced a remarkable 238% increase in gross profit, peaking in 2023. Ingersoll Rand Inc., while more stable, saw a 207% rise during the same period, with significant growth post-2020.
These trends highlight the resilience and adaptability of these companies amidst global economic shifts. Investors and industry analysts should consider these patterns when evaluating future opportunities in these sectors.
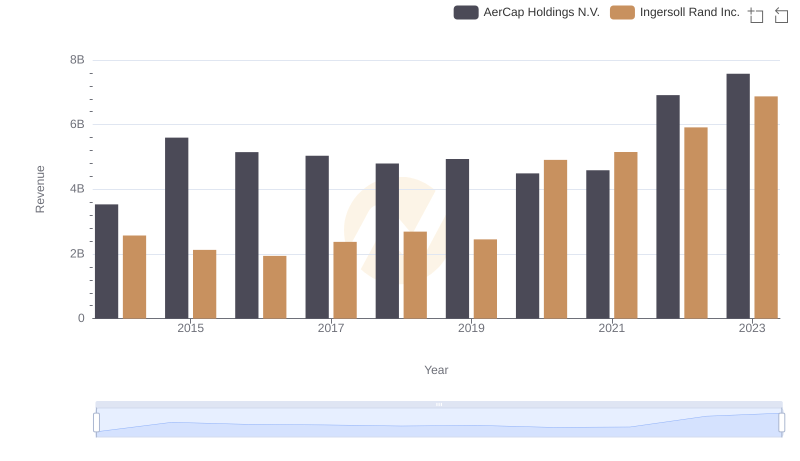
Revenue Insights: Ingersoll Rand Inc. and AerCap Holdings N.V. Performance Compared
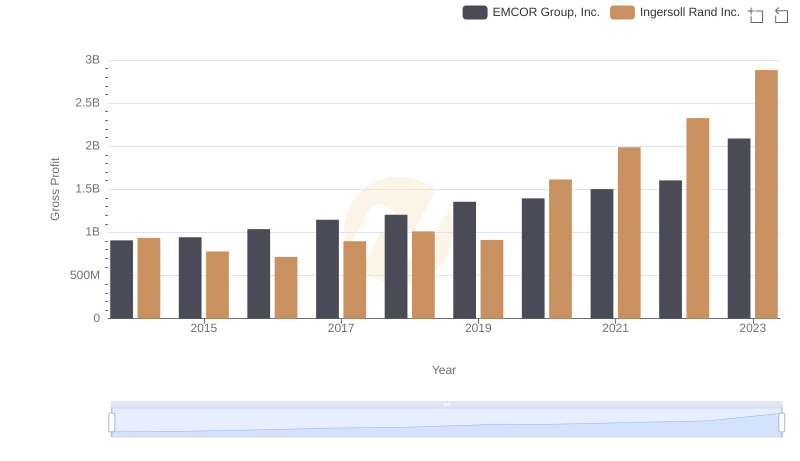
Gross Profit Comparison: Ingersoll Rand Inc. and EMCOR Group, Inc. Trends
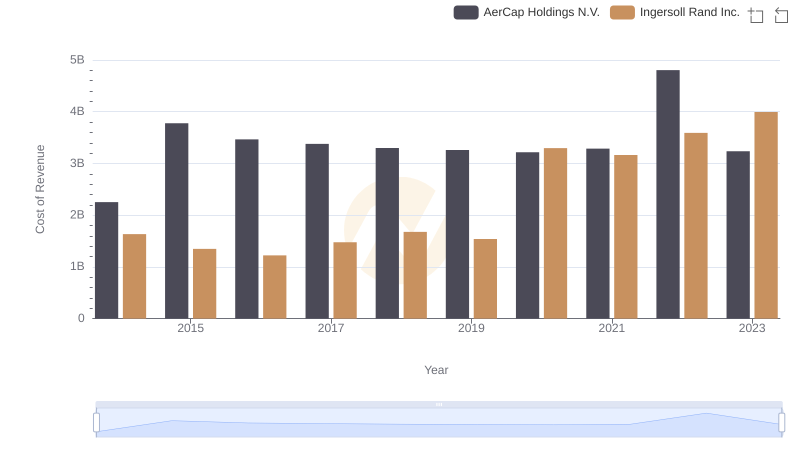
Analyzing Cost of Revenue: Ingersoll Rand Inc. and AerCap Holdings N.V.
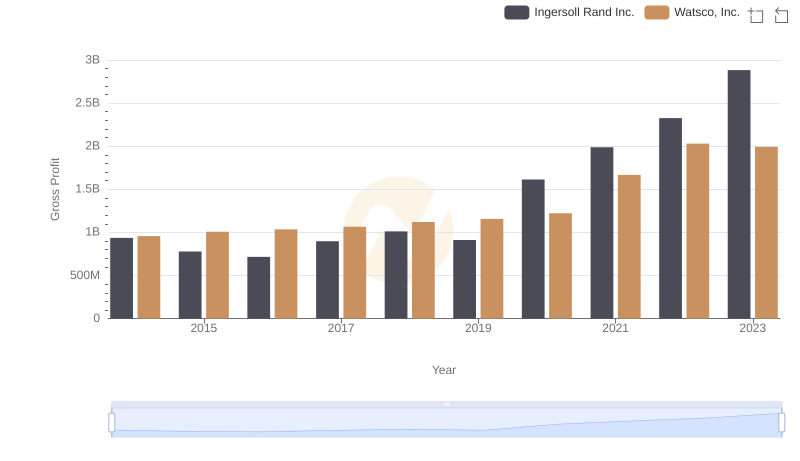
Gross Profit Comparison: Ingersoll Rand Inc. and Watsco, Inc. Trends
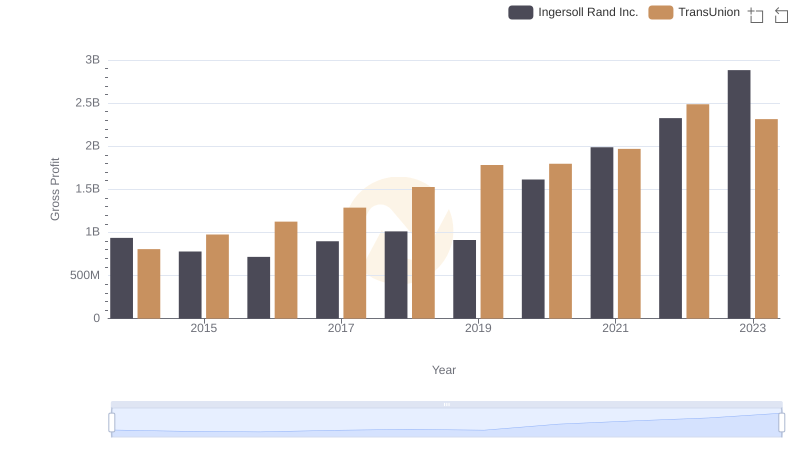
Ingersoll Rand Inc. and TransUnion: A Detailed Gross Profit Analysis
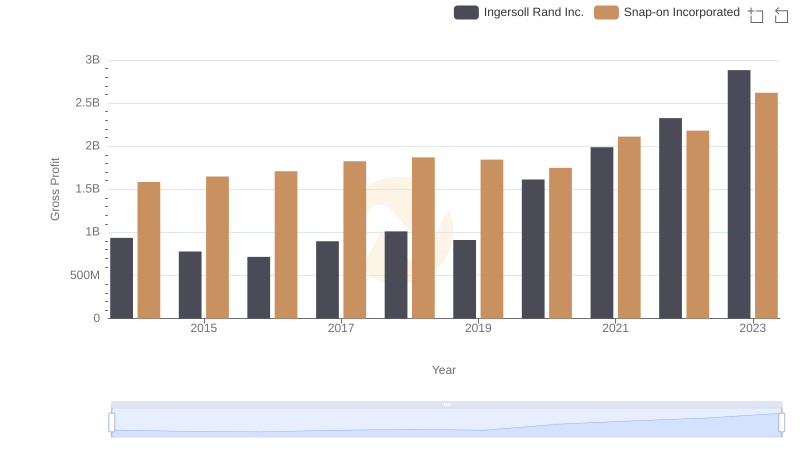
Key Insights on Gross Profit: Ingersoll Rand Inc. vs Snap-on Incorporated
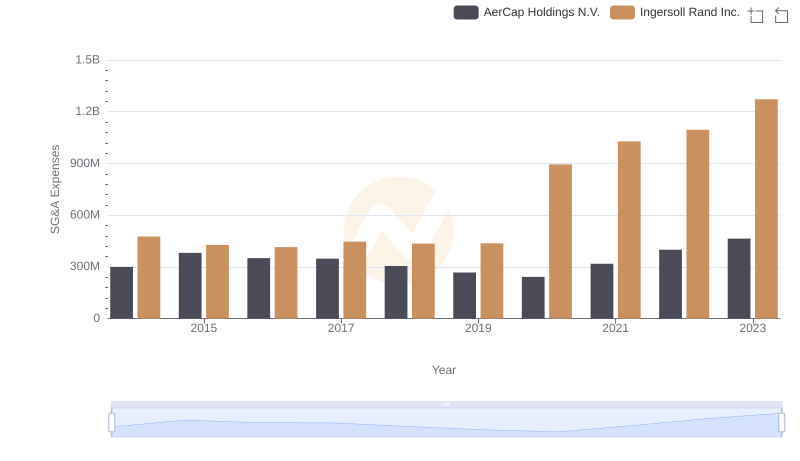
Breaking Down SG&A Expenses: Ingersoll Rand Inc. vs AerCap Holdings N.V.
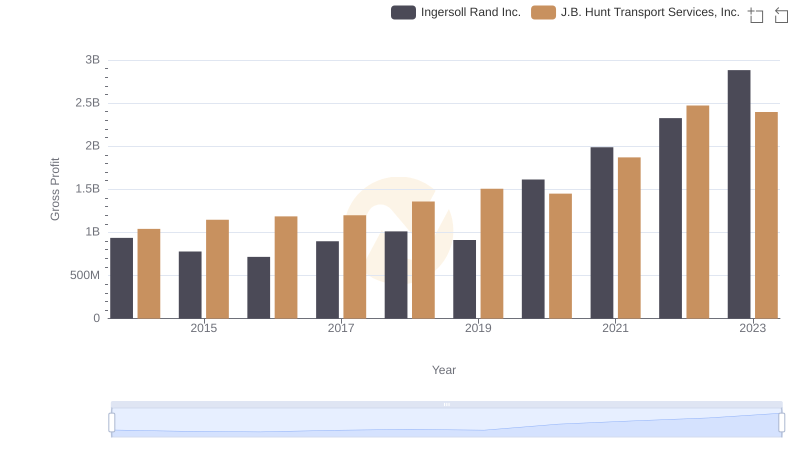
Gross Profit Comparison: Ingersoll Rand Inc. and J.B. Hunt Transport Services, Inc. Trends