| __timestamp | Ingersoll Rand Inc. | Stanley Black & Decker, Inc. |
|---|---|---|
| Wednesday, January 1, 2014 | 1633224000 | 7235900000 |
| Thursday, January 1, 2015 | 1347800000 | 7099800000 |
| Friday, January 1, 2016 | 1222705000 | 7139700000 |
| Sunday, January 1, 2017 | 1477500000 | 7969200000 |
| Monday, January 1, 2018 | 1677300000 | 9080500000 |
| Tuesday, January 1, 2019 | 1540200000 | 9636700000 |
| Wednesday, January 1, 2020 | 3296800000 | 9566700000 |
| Friday, January 1, 2021 | 3163900000 | 10423000000 |
| Saturday, January 1, 2022 | 3590700000 | 12663300000 |
| Sunday, January 1, 2023 | 3993900000 | 11683100000 |
| Monday, January 1, 2024 | 0 | 10851300000 |
Igniting the spark of knowledge
Ingersoll Rand Inc. and Stanley Black & Decker, Inc. have long been stalwarts in the industrial sector, each with a storied history of innovation and growth. From 2014 to 2023, these companies have shown distinct trends in their cost of revenue, reflecting their strategic priorities and market conditions.
Ingersoll Rand Inc. saw a significant increase in its cost of revenue, rising by approximately 145% over the decade. This surge, particularly noticeable from 2020 onwards, suggests a strategic expansion or increased operational costs. In contrast, Stanley Black & Decker, Inc. experienced a steadier growth of about 61% in the same period, peaking in 2022. This could indicate a more consistent approach to scaling operations or managing costs.
These trends offer a fascinating glimpse into how two industry leaders navigate the complexities of the global market, each with its unique approach to growth and sustainability.
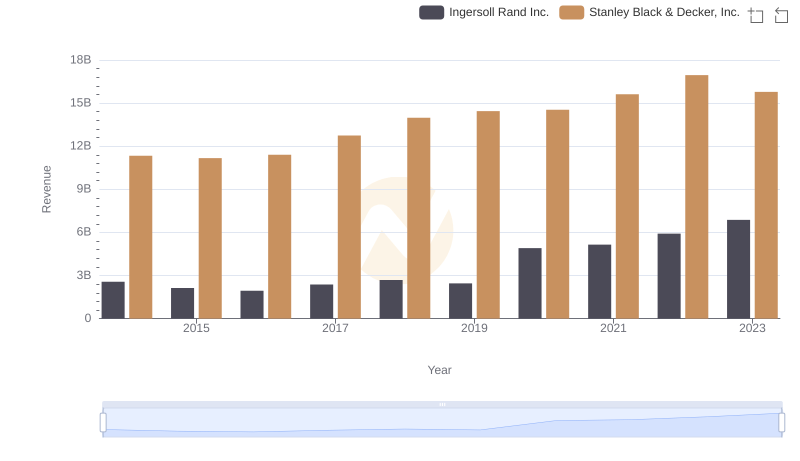
Ingersoll Rand Inc. and Stanley Black & Decker, Inc.: A Comprehensive Revenue Analysis
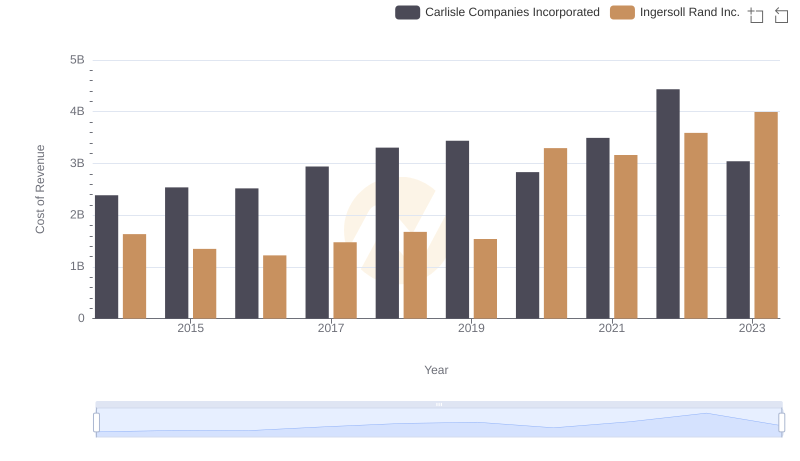
Cost of Revenue Trends: Ingersoll Rand Inc. vs Carlisle Companies Incorporated
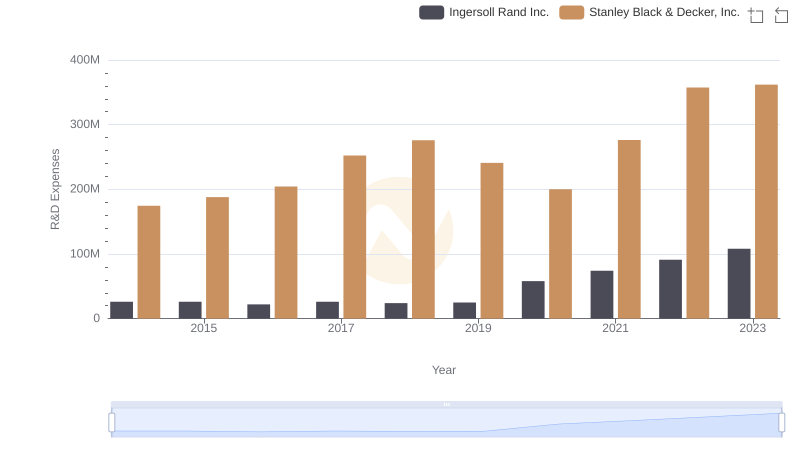
Ingersoll Rand Inc. or Stanley Black & Decker, Inc.: Who Invests More in Innovation?
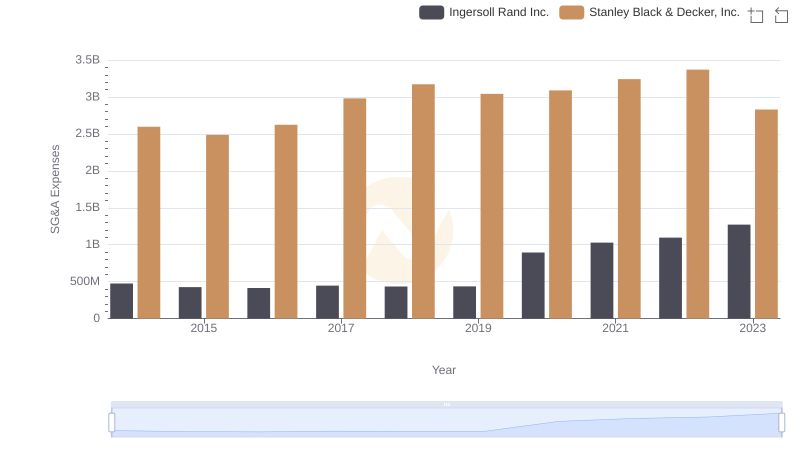
Who Optimizes SG&A Costs Better? Ingersoll Rand Inc. or Stanley Black & Decker, Inc.

Ingersoll Rand Inc. or Stanley Black & Decker, Inc.: Who Leads in Yearly Revenue?