| __timestamp | Ingersoll Rand Inc. | Masco Corporation |
|---|---|---|
| Wednesday, January 1, 2014 | 1633224000 | 6134000000 |
| Thursday, January 1, 2015 | 1347800000 | 4889000000 |
| Friday, January 1, 2016 | 1222705000 | 4901000000 |
| Sunday, January 1, 2017 | 1477500000 | 5033000000 |
| Monday, January 1, 2018 | 1677300000 | 5670000000 |
| Tuesday, January 1, 2019 | 1540200000 | 4336000000 |
| Wednesday, January 1, 2020 | 3296800000 | 4601000000 |
| Friday, January 1, 2021 | 3163900000 | 5512000000 |
| Saturday, January 1, 2022 | 3590700000 | 5967000000 |
| Sunday, January 1, 2023 | 3993900000 | 5131000000 |
| Monday, January 1, 2024 | 0 | 4997000000 |
Unleashing the power of data
In the ever-evolving landscape of industrial and home improvement sectors, understanding cost dynamics is crucial. From 2014 to 2023, Ingersoll Rand Inc. and Masco Corporation have showcased distinct trajectories in their cost of revenue. Ingersoll Rand Inc. experienced a significant surge, with costs nearly tripling from 2014 to 2023, peaking at approximately $4 billion. This reflects a strategic expansion and increased operational scale. Conversely, Masco Corporation's cost of revenue remained relatively stable, with a slight decline of around 16% from its 2014 peak of $6.1 billion. This stability suggests efficient cost management amidst fluctuating market conditions. The contrasting trends highlight the diverse strategies employed by these industry giants, offering valuable insights into their operational efficiencies and market positioning. As businesses navigate the complexities of cost management, these insights serve as a benchmark for strategic decision-making.
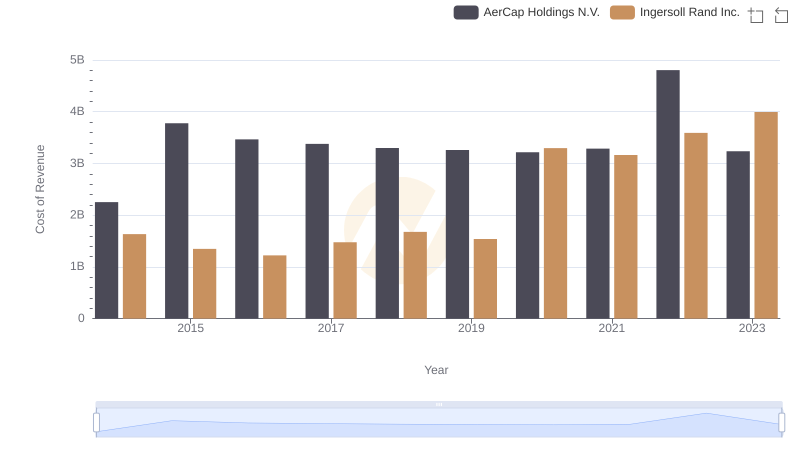
Analyzing Cost of Revenue: Ingersoll Rand Inc. and AerCap Holdings N.V.
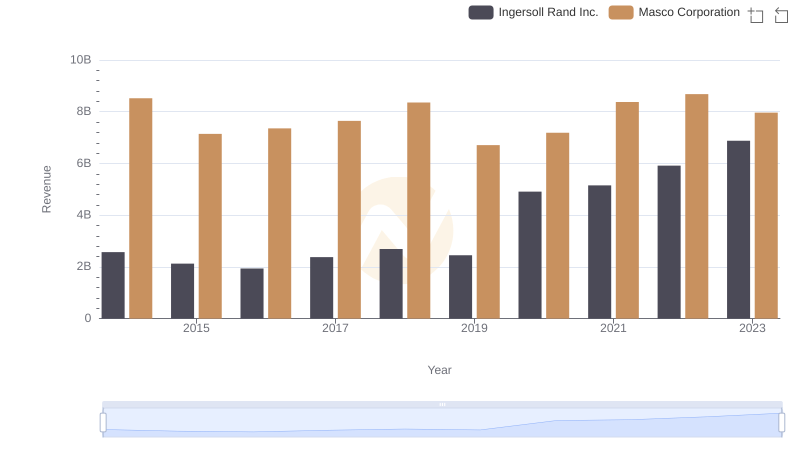
Revenue Insights: Ingersoll Rand Inc. and Masco Corporation Performance Compared
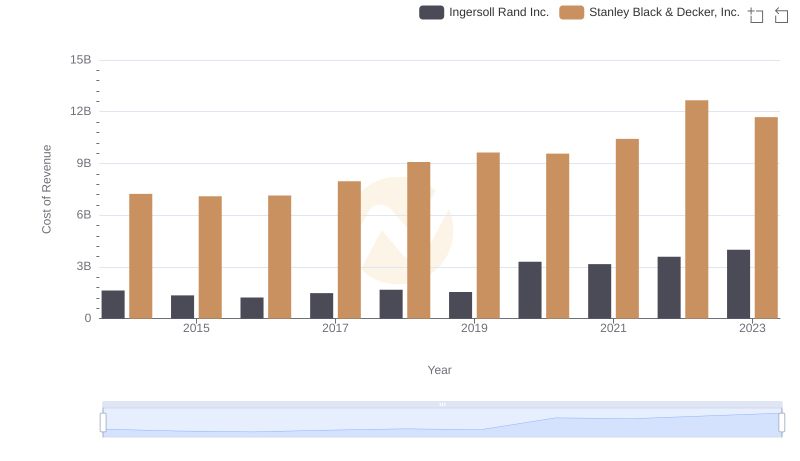
Cost of Revenue Trends: Ingersoll Rand Inc. vs Stanley Black & Decker, Inc.
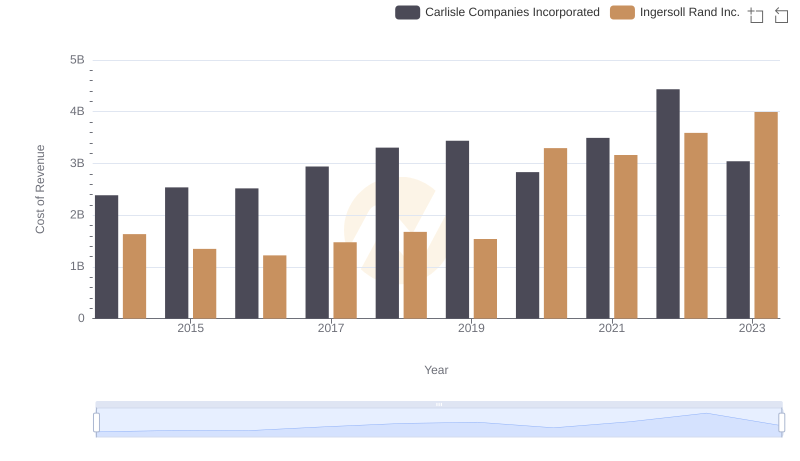
Cost of Revenue Trends: Ingersoll Rand Inc. vs Carlisle Companies Incorporated
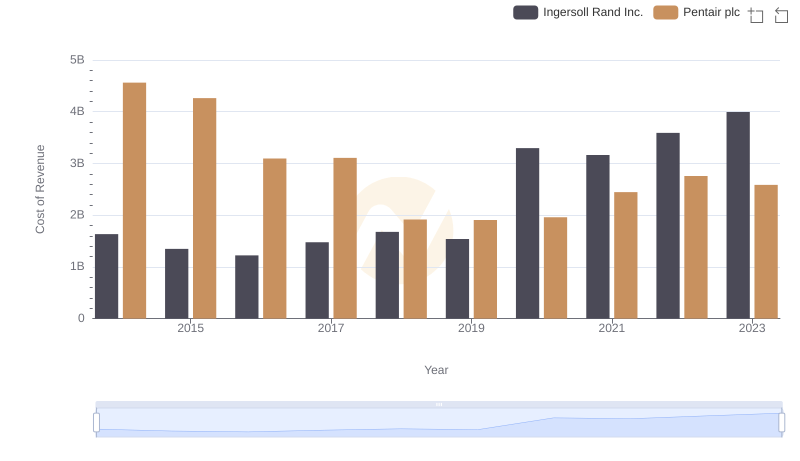
Cost of Revenue: Key Insights for Ingersoll Rand Inc. and Pentair plc
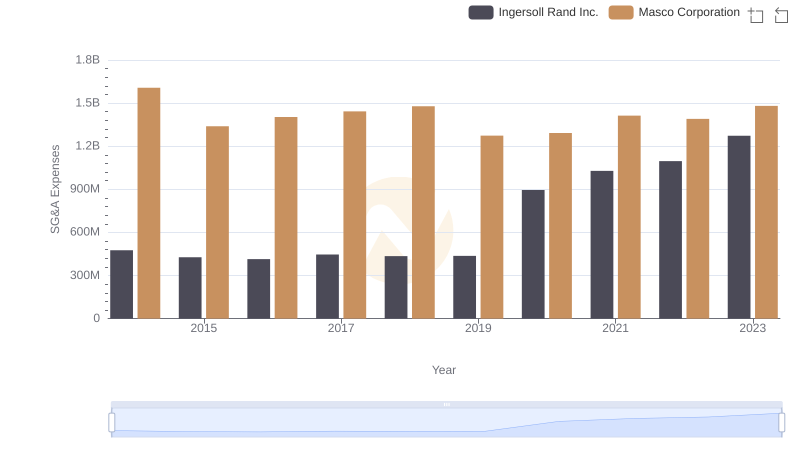
Ingersoll Rand Inc. or Masco Corporation: Who Manages SG&A Costs Better?