| __timestamp | AerCap Holdings N.V. | Ingersoll Rand Inc. |
|---|---|---|
| Wednesday, January 1, 2014 | 3535797000 | 2570005000 |
| Thursday, January 1, 2015 | 5598662000 | 2126900000 |
| Friday, January 1, 2016 | 5152131000 | 1939436000 |
| Sunday, January 1, 2017 | 5037493000 | 2375400000 |
| Monday, January 1, 2018 | 4799980000 | 2689800000 |
| Tuesday, January 1, 2019 | 4937340000 | 2451900000 |
| Wednesday, January 1, 2020 | 4493629000 | 4910200000 |
| Friday, January 1, 2021 | 4588930000 | 5152400000 |
| Saturday, January 1, 2022 | 6914985000 | 5916300000 |
| Sunday, January 1, 2023 | 7574664000 | 6876100000 |
| Monday, January 1, 2024 | 0 |
Data in motion
In the competitive landscape of global industries, Ingersoll Rand Inc. and AerCap Holdings N.V. have showcased remarkable revenue trajectories over the past decade. From 2014 to 2023, AerCap Holdings N.V. experienced a robust growth of approximately 114%, with revenues surging from $3.5 billion to $7.6 billion. This growth underscores AerCap's strategic positioning in the aviation leasing sector, capitalizing on the increasing demand for aircraft.
Conversely, Ingersoll Rand Inc., a leader in industrial solutions, demonstrated a steady revenue increase of around 167% during the same period, climbing from $2.6 billion to $6.9 billion. This growth reflects the company's successful expansion and innovation in industrial technologies.
Both companies have navigated economic fluctuations and industry challenges, yet their revenue trends highlight their resilience and strategic foresight. As we look to the future, these insights provide a window into the evolving dynamics of their respective industries.
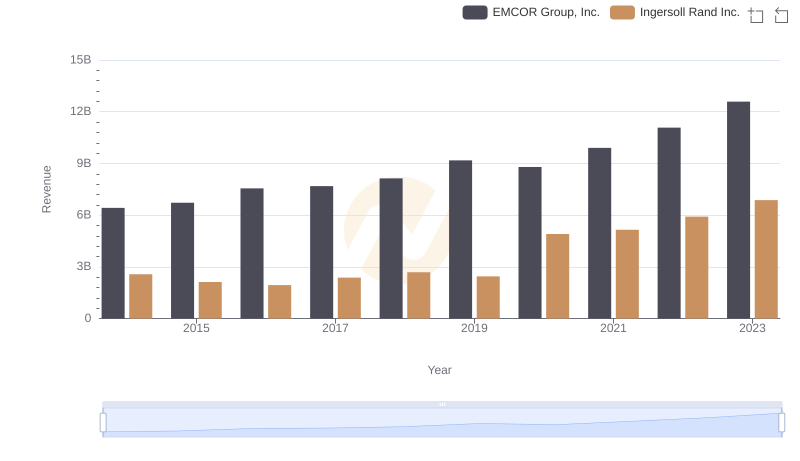
Breaking Down Revenue Trends: Ingersoll Rand Inc. vs EMCOR Group, Inc.
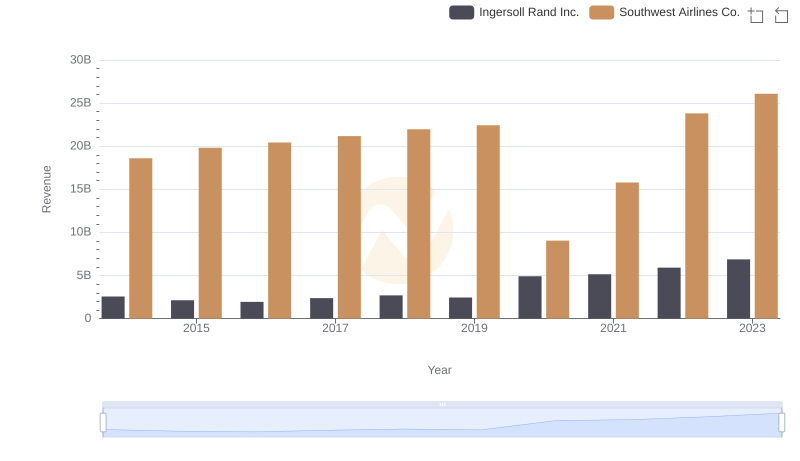
Ingersoll Rand Inc. vs Southwest Airlines Co.: Examining Key Revenue Metrics
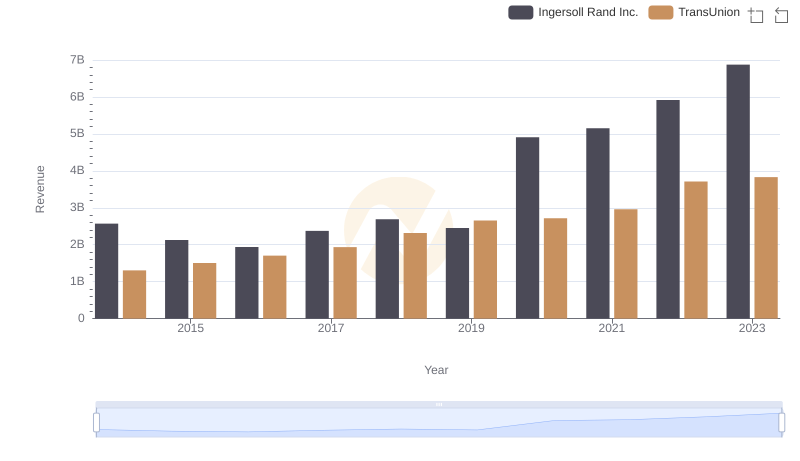
Ingersoll Rand Inc. vs TransUnion: Annual Revenue Growth Compared
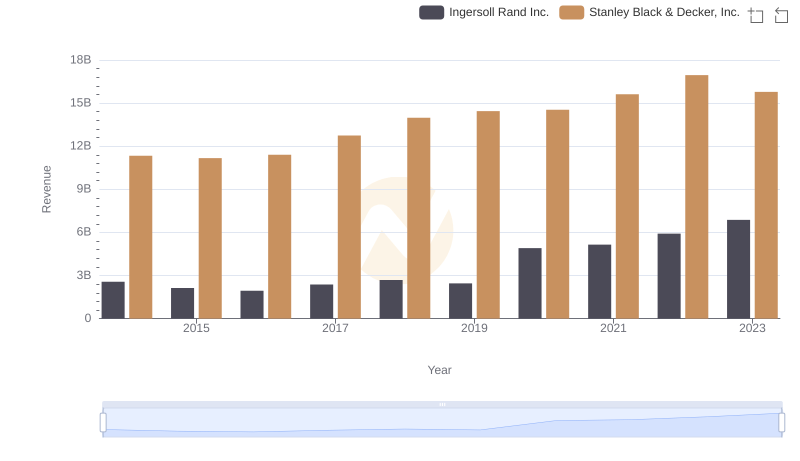
Ingersoll Rand Inc. and Stanley Black & Decker, Inc.: A Comprehensive Revenue Analysis
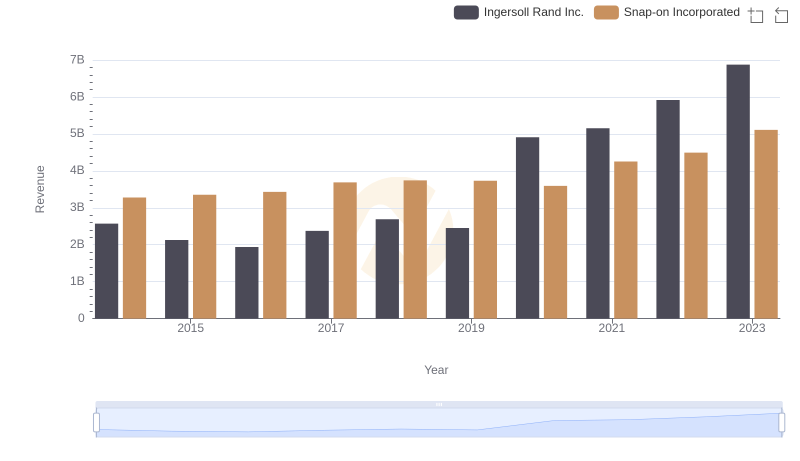
Ingersoll Rand Inc. vs Snap-on Incorporated: Examining Key Revenue Metrics
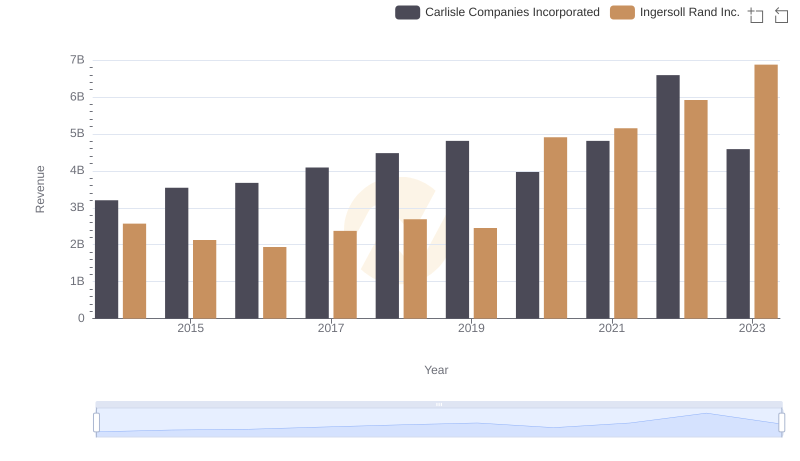
Ingersoll Rand Inc. vs Carlisle Companies Incorporated: Annual Revenue Growth Compared
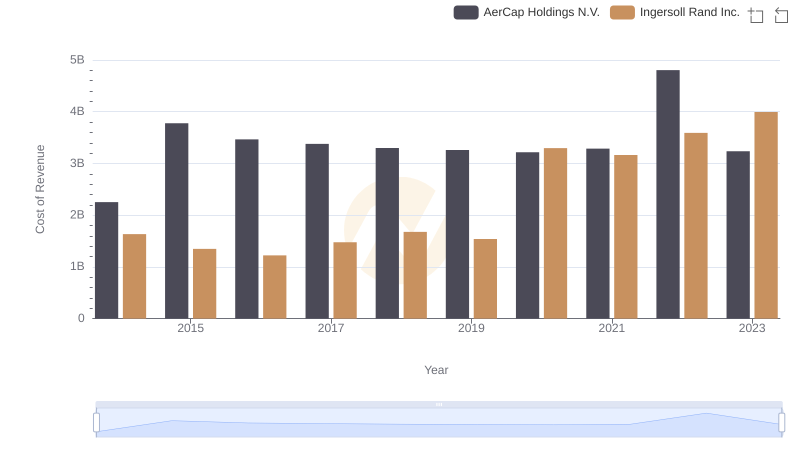
Analyzing Cost of Revenue: Ingersoll Rand Inc. and AerCap Holdings N.V.
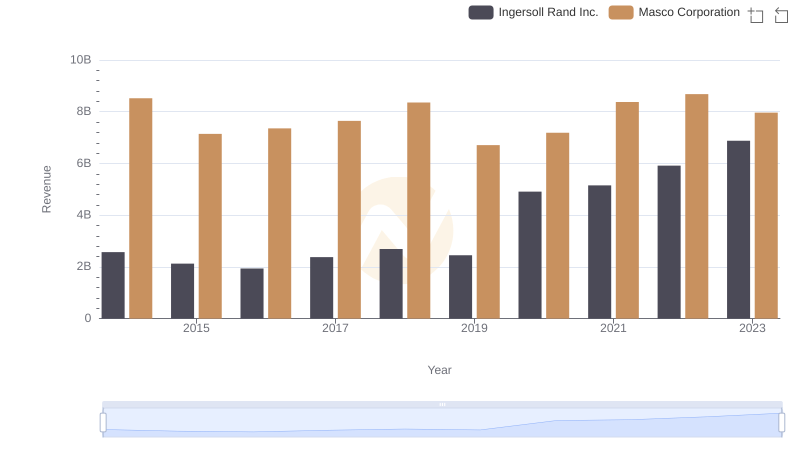
Revenue Insights: Ingersoll Rand Inc. and Masco Corporation Performance Compared
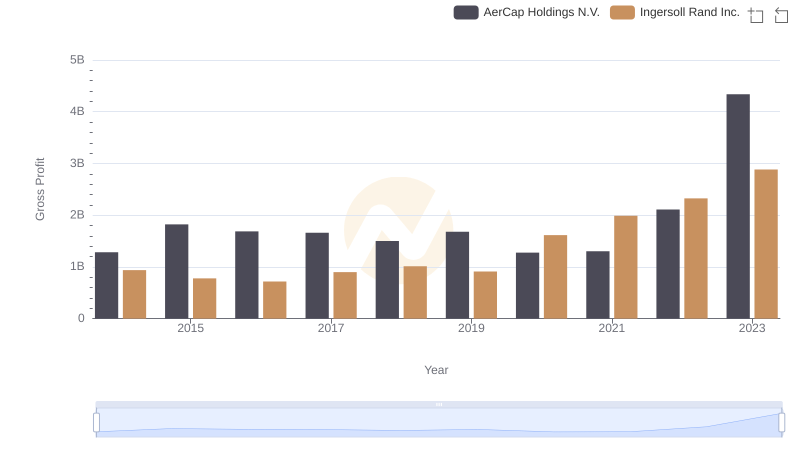
Gross Profit Comparison: Ingersoll Rand Inc. and AerCap Holdings N.V. Trends
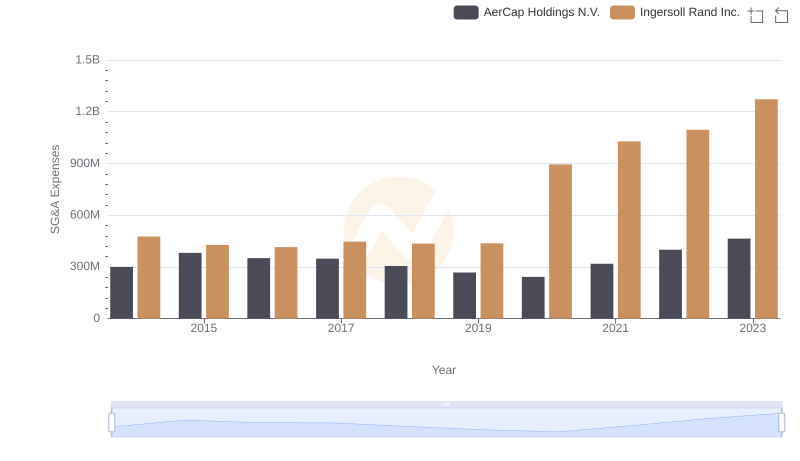
Breaking Down SG&A Expenses: Ingersoll Rand Inc. vs AerCap Holdings N.V.