| __timestamp | Ingersoll Rand Inc. | Watsco, Inc. |
|---|---|---|
| Wednesday, January 1, 2014 | 1633224000 | 2988138000 |
| Thursday, January 1, 2015 | 1347800000 | 3105882000 |
| Friday, January 1, 2016 | 1222705000 | 3186118000 |
| Sunday, January 1, 2017 | 1477500000 | 3276296000 |
| Monday, January 1, 2018 | 1677300000 | 3426401000 |
| Tuesday, January 1, 2019 | 1540200000 | 3613406000 |
| Wednesday, January 1, 2020 | 3296800000 | 3832107000 |
| Friday, January 1, 2021 | 3163900000 | 4612647000 |
| Saturday, January 1, 2022 | 3590700000 | 5244055000 |
| Sunday, January 1, 2023 | 3993900000 | 5291627000 |
| Monday, January 1, 2024 | 0 | 5573604000 |
Igniting the spark of knowledge
In the ever-evolving landscape of industrial and HVAC sectors, understanding cost dynamics is crucial. From 2014 to 2023, Ingersoll Rand Inc. and Watsco, Inc. have shown distinct trajectories in their cost of revenue. Ingersoll Rand's cost of revenue surged by approximately 145%, peaking at nearly $4 billion in 2023. This reflects strategic expansions and possibly increased operational efficiencies. Meanwhile, Watsco, Inc. experienced a 77% increase, reaching over $5.2 billion, indicating robust growth in the HVAC market. Notably, 2020 marked a significant leap for both companies, likely influenced by global economic shifts. These insights underscore the importance of cost management in maintaining competitive advantage. As these giants continue to navigate market challenges, stakeholders must keep a keen eye on cost trends to anticipate future performance.
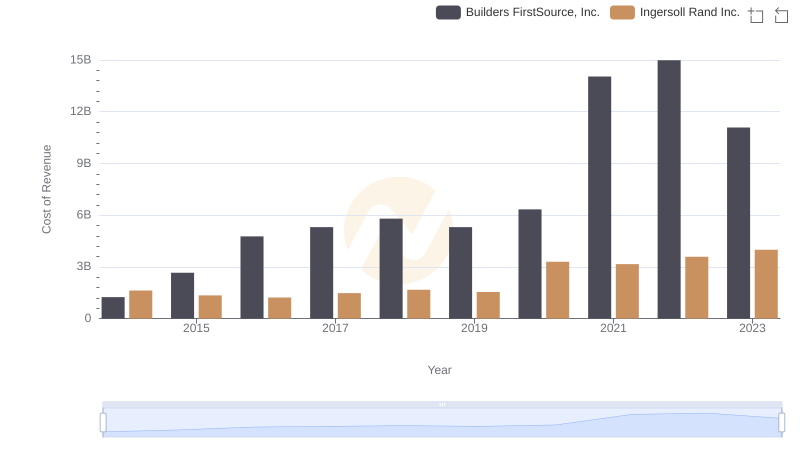
Ingersoll Rand Inc. vs Builders FirstSource, Inc.: Efficiency in Cost of Revenue Explored
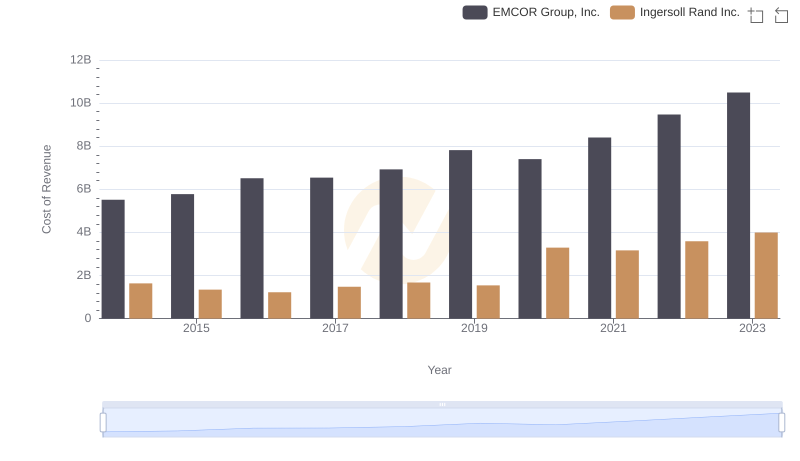
Comparing Cost of Revenue Efficiency: Ingersoll Rand Inc. vs EMCOR Group, Inc.
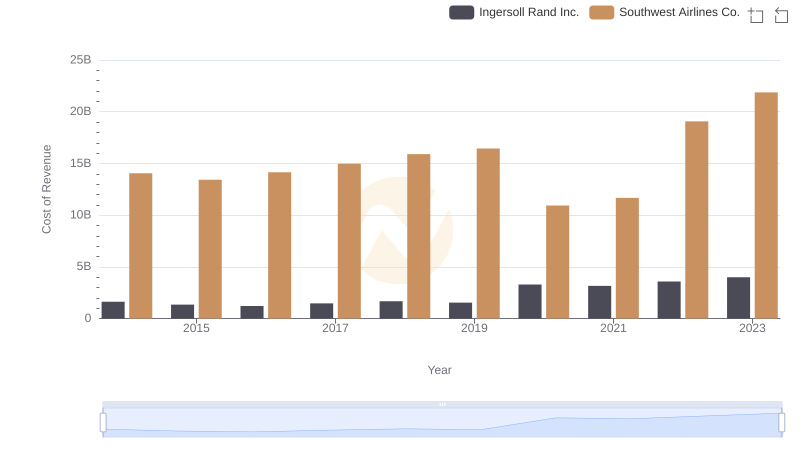
Cost of Revenue Trends: Ingersoll Rand Inc. vs Southwest Airlines Co.
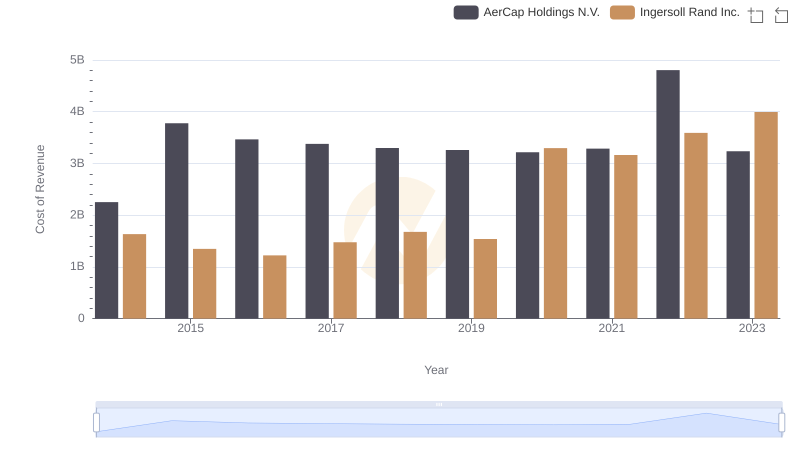
Analyzing Cost of Revenue: Ingersoll Rand Inc. and AerCap Holdings N.V.
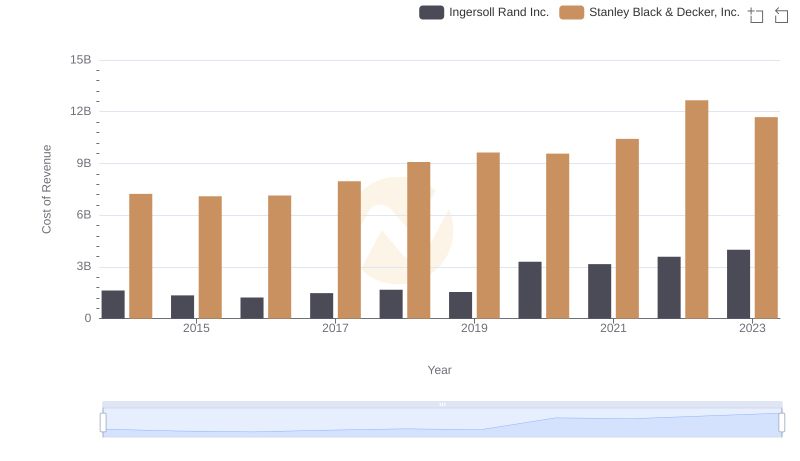
Cost of Revenue Trends: Ingersoll Rand Inc. vs Stanley Black & Decker, Inc.
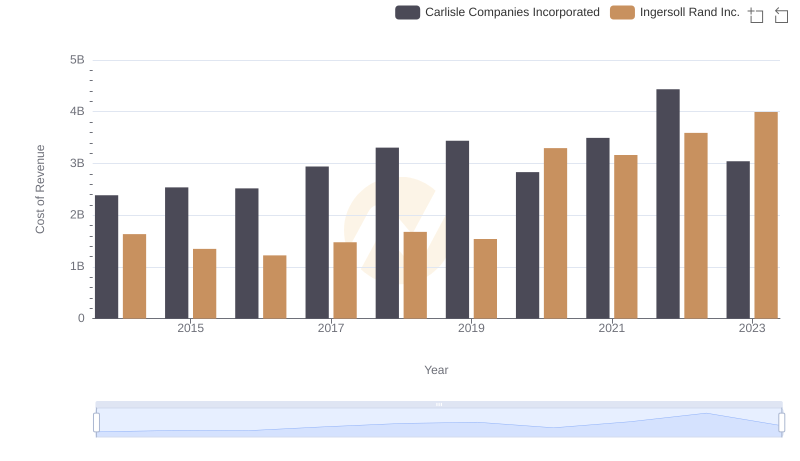
Cost of Revenue Trends: Ingersoll Rand Inc. vs Carlisle Companies Incorporated
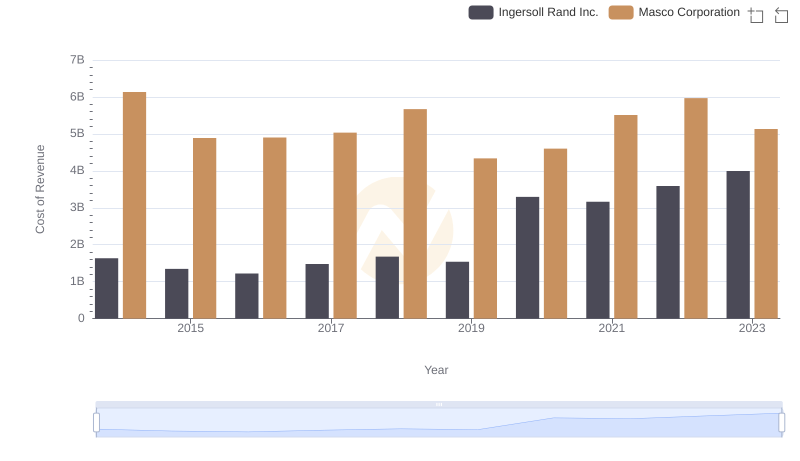
Cost of Revenue: Key Insights for Ingersoll Rand Inc. and Masco Corporation
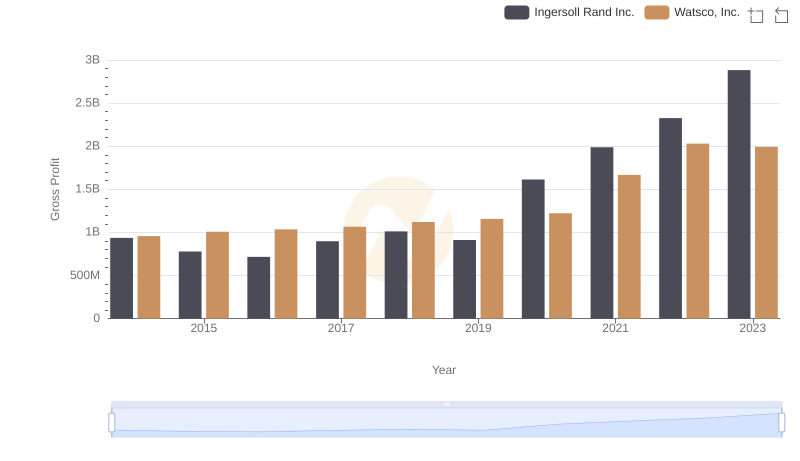
Gross Profit Comparison: Ingersoll Rand Inc. and Watsco, Inc. Trends