| __timestamp | EMCOR Group, Inc. | Ingersoll Rand Inc. |
|---|---|---|
| Wednesday, January 1, 2014 | 5517719000 | 1633224000 |
| Thursday, January 1, 2015 | 5774247000 | 1347800000 |
| Friday, January 1, 2016 | 6513662000 | 1222705000 |
| Sunday, January 1, 2017 | 6539987000 | 1477500000 |
| Monday, January 1, 2018 | 6925178000 | 1677300000 |
| Tuesday, January 1, 2019 | 7818743000 | 1540200000 |
| Wednesday, January 1, 2020 | 7401679000 | 3296800000 |
| Friday, January 1, 2021 | 8401843000 | 3163900000 |
| Saturday, January 1, 2022 | 9472526000 | 3590700000 |
| Sunday, January 1, 2023 | 10493534000 | 3993900000 |
| Monday, January 1, 2024 | 0 |
Unveiling the hidden dimensions of data
In the competitive landscape of industrial services, understanding cost efficiency is crucial. Over the past decade, EMCOR Group, Inc. and Ingersoll Rand Inc. have showcased contrasting trajectories in their cost of revenue. From 2014 to 2023, EMCOR's cost of revenue surged by approximately 90%, reflecting its expansive growth strategy. In contrast, Ingersoll Rand's cost of revenue increased by about 145%, indicating a more aggressive scaling approach. Notably, in 2023, EMCOR's cost of revenue was nearly 2.6 times that of Ingersoll Rand, highlighting its larger operational scale. This comparison underscores the diverse strategies these companies employ to manage costs while expanding their market presence. As the industrial sector evolves, monitoring such financial metrics will be pivotal for stakeholders aiming to gauge corporate efficiency and strategic direction.
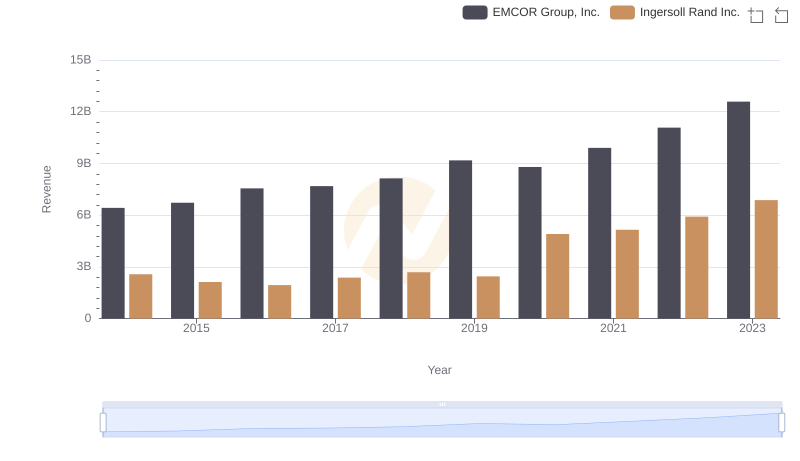
Breaking Down Revenue Trends: Ingersoll Rand Inc. vs EMCOR Group, Inc.
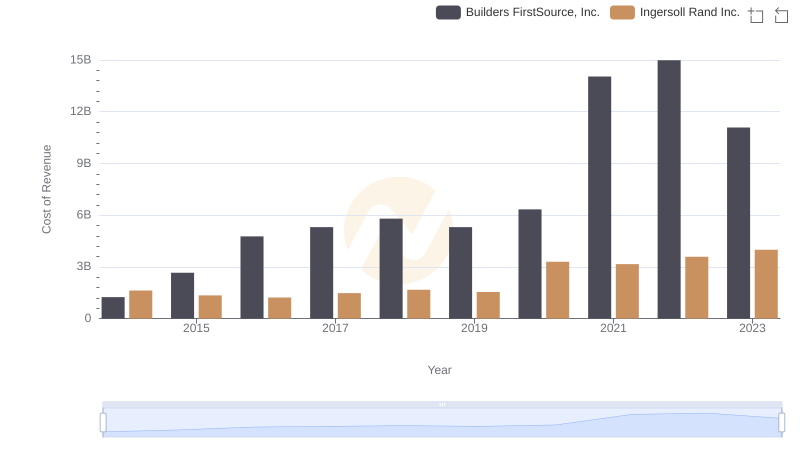
Ingersoll Rand Inc. vs Builders FirstSource, Inc.: Efficiency in Cost of Revenue Explored
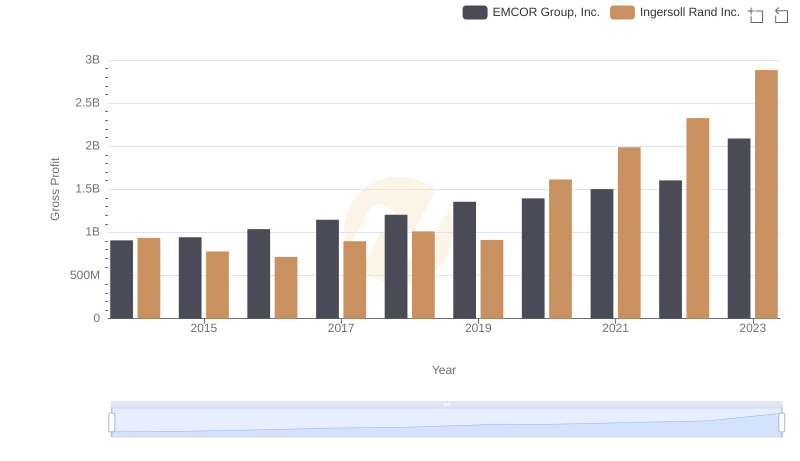
Gross Profit Comparison: Ingersoll Rand Inc. and EMCOR Group, Inc. Trends
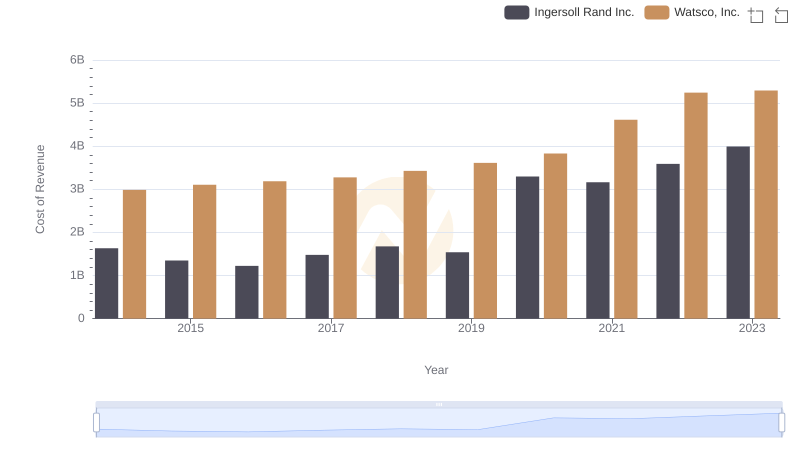
Cost of Revenue: Key Insights for Ingersoll Rand Inc. and Watsco, Inc.
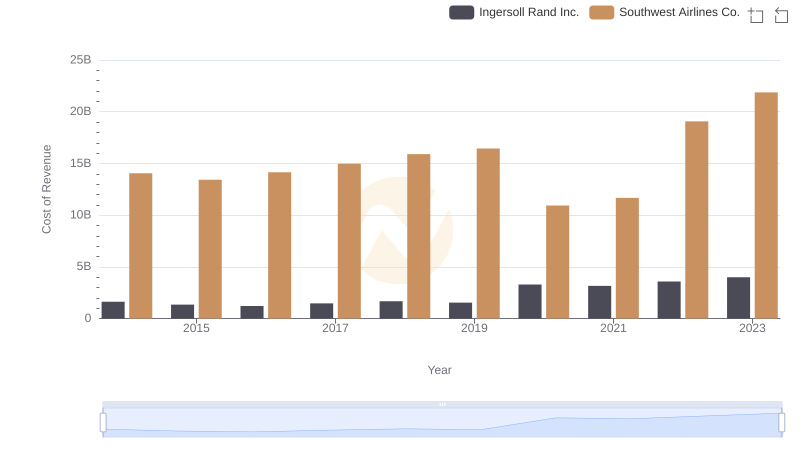
Cost of Revenue Trends: Ingersoll Rand Inc. vs Southwest Airlines Co.
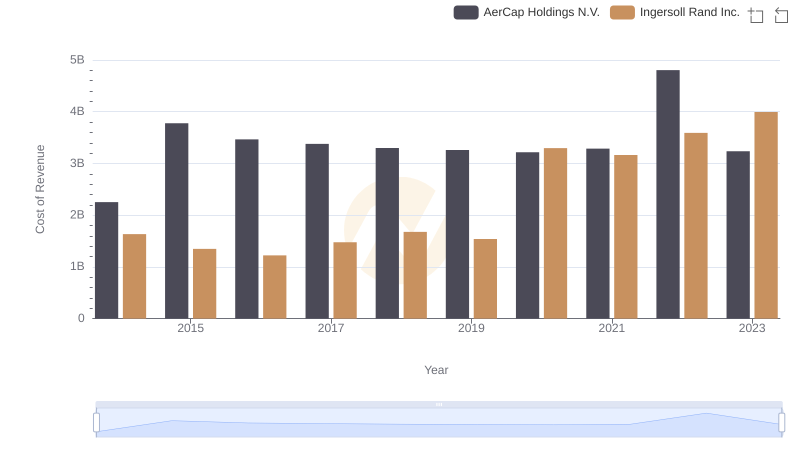
Analyzing Cost of Revenue: Ingersoll Rand Inc. and AerCap Holdings N.V.
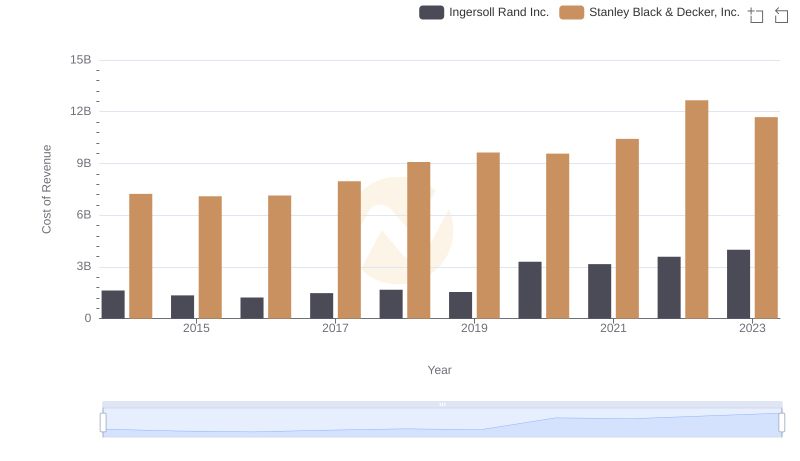
Cost of Revenue Trends: Ingersoll Rand Inc. vs Stanley Black & Decker, Inc.
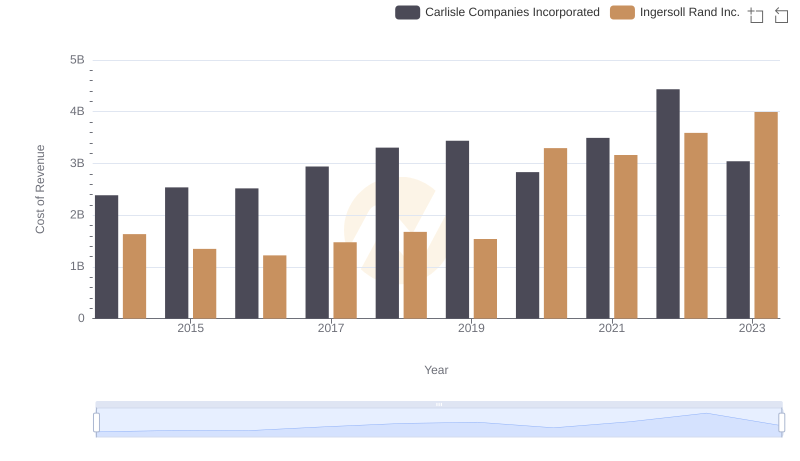
Cost of Revenue Trends: Ingersoll Rand Inc. vs Carlisle Companies Incorporated