| __timestamp | Ingersoll Rand Inc. | Southwest Airlines Co. |
|---|---|---|
| Wednesday, January 1, 2014 | 1633224000 | 14049000000 |
| Thursday, January 1, 2015 | 1347800000 | 13423000000 |
| Friday, January 1, 2016 | 1222705000 | 14151000000 |
| Sunday, January 1, 2017 | 1477500000 | 14968000000 |
| Monday, January 1, 2018 | 1677300000 | 15907000000 |
| Tuesday, January 1, 2019 | 1540200000 | 16445000000 |
| Wednesday, January 1, 2020 | 3296800000 | 10938000000 |
| Friday, January 1, 2021 | 3163900000 | 11675000000 |
| Saturday, January 1, 2022 | 3590700000 | 19062000000 |
| Sunday, January 1, 2023 | 3993900000 | 21868000000 |
| Monday, January 1, 2024 | 0 | 23024000000 |
Unveiling the hidden dimensions of data
In the ever-evolving landscape of American industry, the cost of revenue serves as a critical indicator of operational efficiency and market dynamics. From 2014 to 2023, Ingersoll Rand Inc. and Southwest Airlines Co. have navigated distinct paths. Ingersoll Rand, a stalwart in the industrial sector, saw its cost of revenue rise by approximately 145%, peaking in 2023. This reflects strategic expansions and market adaptations. Meanwhile, Southwest Airlines, a leader in the aviation industry, experienced a 56% increase over the same period, with notable fluctuations due to the pandemic's impact on travel. By 2023, Southwest's cost of revenue was nearly five times that of Ingersoll Rand, underscoring the capital-intensive nature of the airline industry. These trends highlight the diverse challenges and opportunities faced by companies in different sectors, offering valuable insights for investors and industry analysts alike.
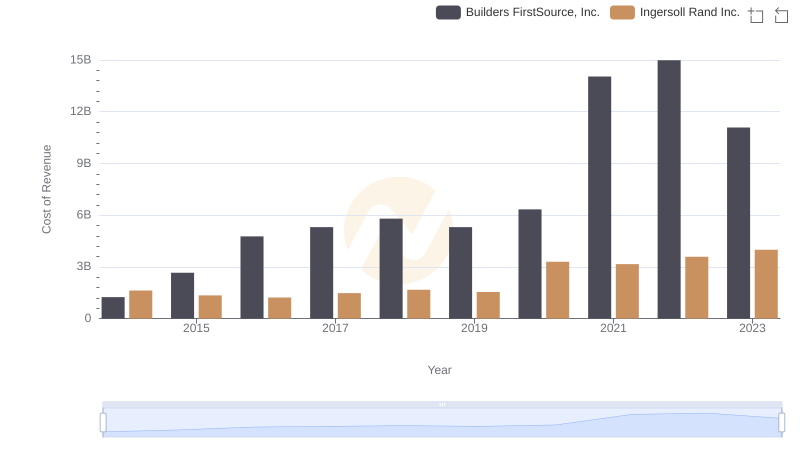
Ingersoll Rand Inc. vs Builders FirstSource, Inc.: Efficiency in Cost of Revenue Explored
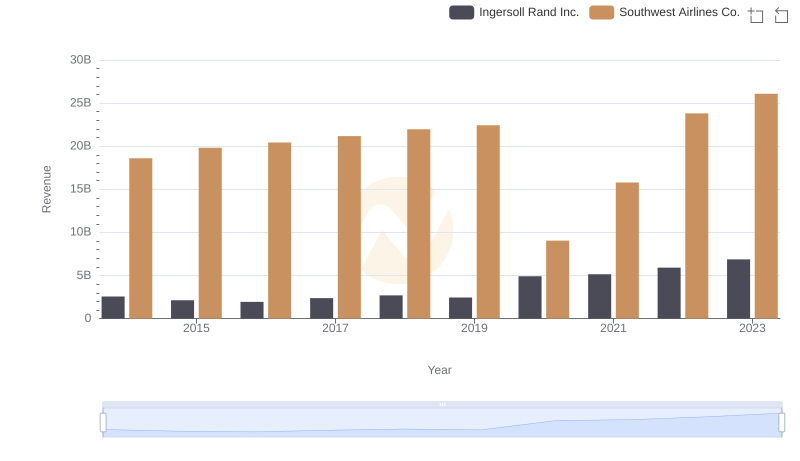
Ingersoll Rand Inc. vs Southwest Airlines Co.: Examining Key Revenue Metrics
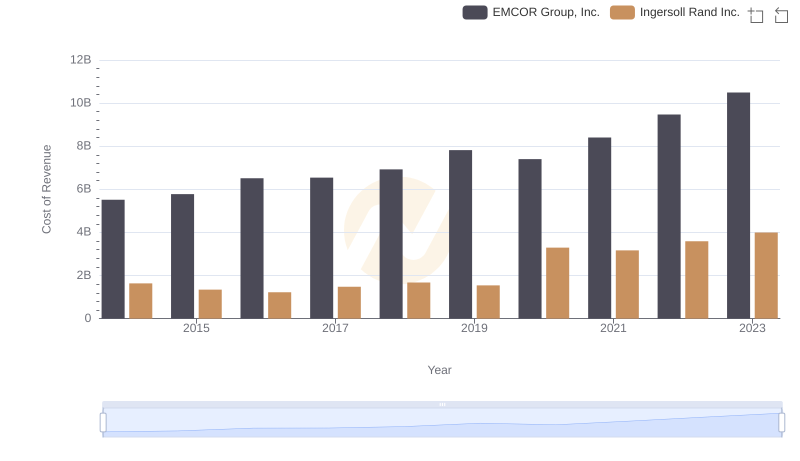
Comparing Cost of Revenue Efficiency: Ingersoll Rand Inc. vs EMCOR Group, Inc.
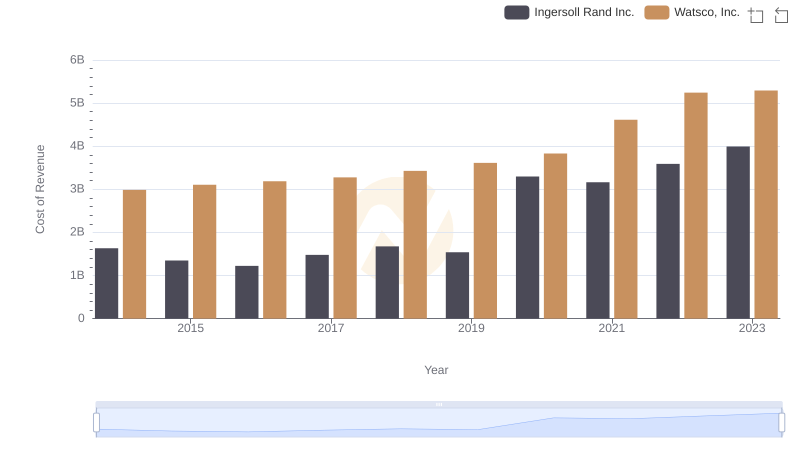
Cost of Revenue: Key Insights for Ingersoll Rand Inc. and Watsco, Inc.
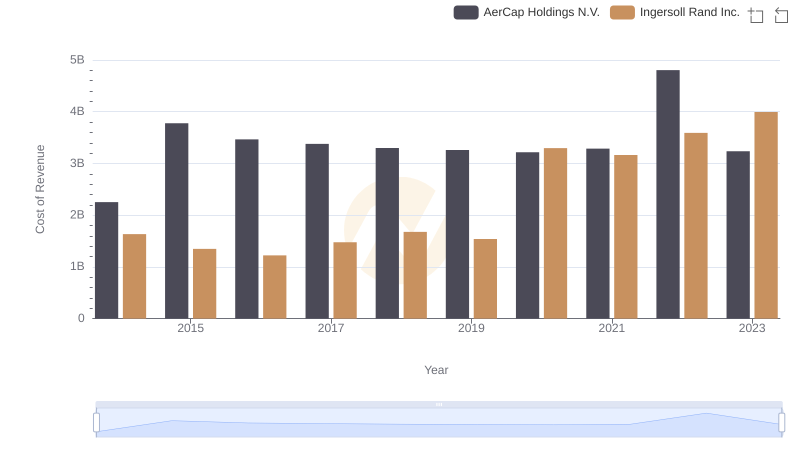
Analyzing Cost of Revenue: Ingersoll Rand Inc. and AerCap Holdings N.V.
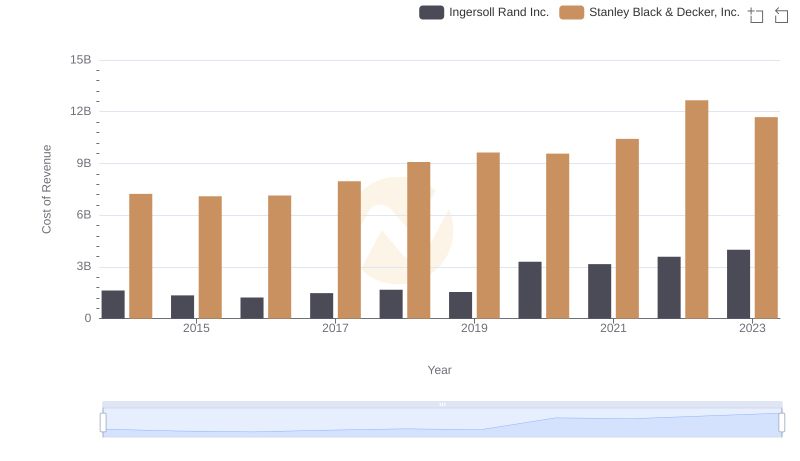
Cost of Revenue Trends: Ingersoll Rand Inc. vs Stanley Black & Decker, Inc.
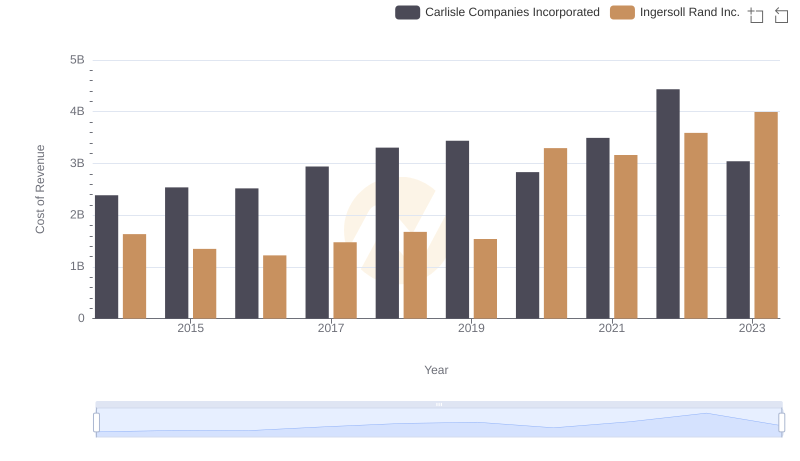
Cost of Revenue Trends: Ingersoll Rand Inc. vs Carlisle Companies Incorporated
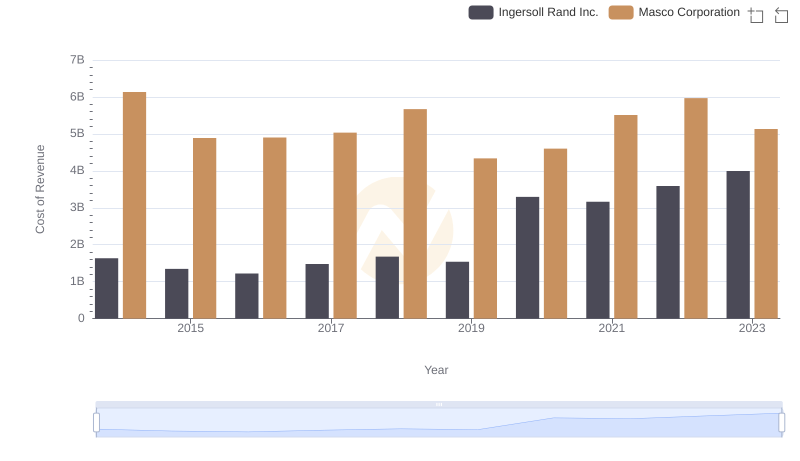
Cost of Revenue: Key Insights for Ingersoll Rand Inc. and Masco Corporation