| __timestamp | Eaton Corporation plc | Southwest Airlines Co. |
|---|---|---|
| Wednesday, January 1, 2014 | 15646000000 | 14049000000 |
| Thursday, January 1, 2015 | 14292000000 | 13423000000 |
| Friday, January 1, 2016 | 13400000000 | 14151000000 |
| Sunday, January 1, 2017 | 13756000000 | 14968000000 |
| Monday, January 1, 2018 | 14511000000 | 15907000000 |
| Tuesday, January 1, 2019 | 14338000000 | 16445000000 |
| Wednesday, January 1, 2020 | 12408000000 | 10938000000 |
| Friday, January 1, 2021 | 13293000000 | 11675000000 |
| Saturday, January 1, 2022 | 13865000000 | 19062000000 |
| Sunday, January 1, 2023 | 14763000000 | 21868000000 |
| Monday, January 1, 2024 | 15375000000 | 23024000000 |
Infusing magic into the data realm
In the ever-evolving landscape of corporate finance, understanding the cost of revenue is crucial for evaluating a company's efficiency and profitability. This analysis delves into the cost of revenue trends for Eaton Corporation plc and Southwest Airlines Co. from 2014 to 2023.
Eaton Corporation plc, a leader in power management, saw its cost of revenue fluctuate modestly over the decade, peaking in 2014 and experiencing a dip in 2020, likely due to global economic disruptions. By 2023, Eaton's cost of revenue rebounded to approximately 5% below its 2014 peak.
Conversely, Southwest Airlines Co., a major player in the aviation industry, exhibited a more volatile trend. The airline's cost of revenue surged by over 55% from 2014 to 2023, reflecting the industry's dynamic nature and challenges, including the pandemic's impact in 2020.
These insights underscore the importance of strategic cost management in maintaining competitive advantage.
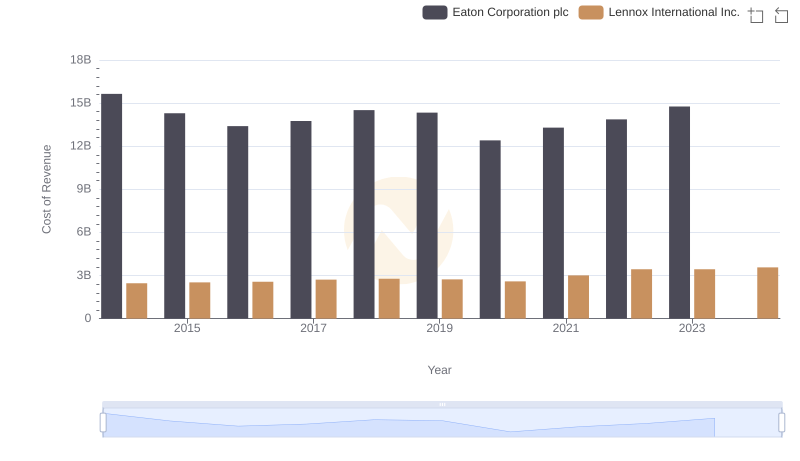
Analyzing Cost of Revenue: Eaton Corporation plc and Lennox International Inc.
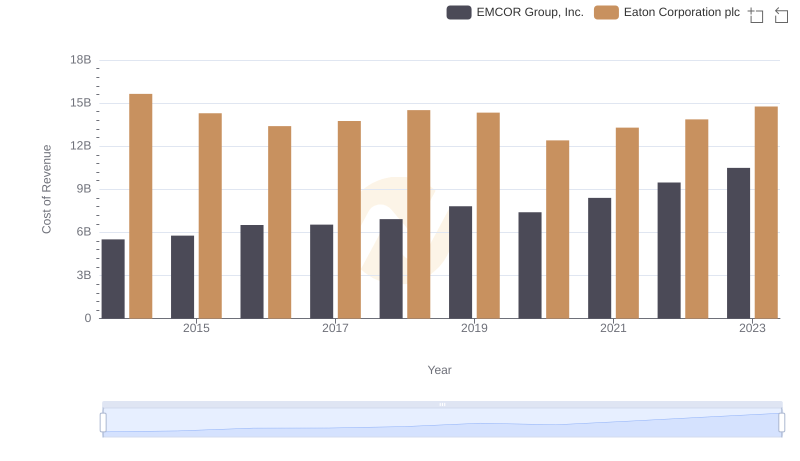
Cost of Revenue: Key Insights for Eaton Corporation plc and EMCOR Group, Inc.
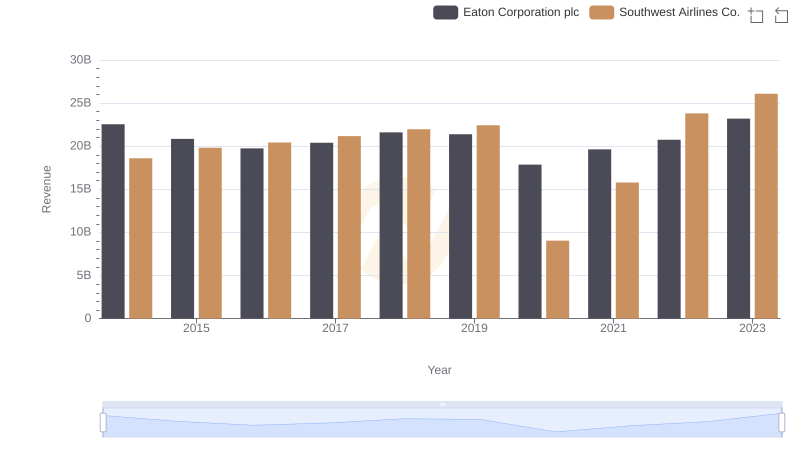
Revenue Insights: Eaton Corporation plc and Southwest Airlines Co. Performance Compared
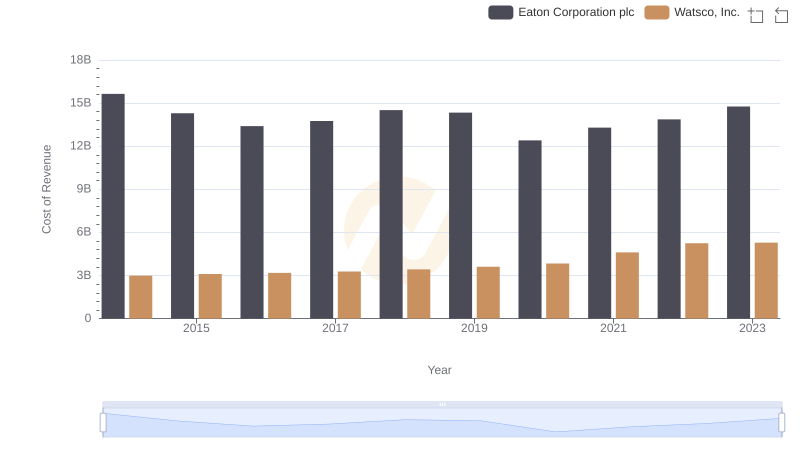
Cost of Revenue Comparison: Eaton Corporation plc vs Watsco, Inc.

Eaton Corporation plc vs AerCap Holdings N.V.: Efficiency in Cost of Revenue Explored

Comparing Cost of Revenue Efficiency: Eaton Corporation plc vs Stanley Black & Decker, Inc.
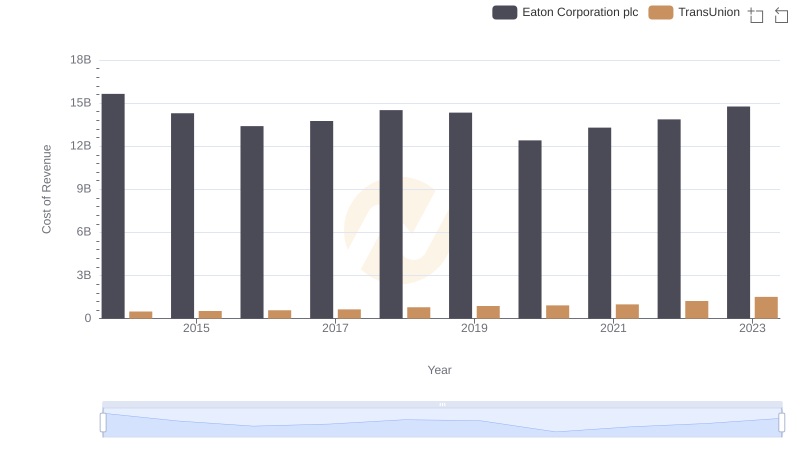
Cost of Revenue Trends: Eaton Corporation plc vs TransUnion
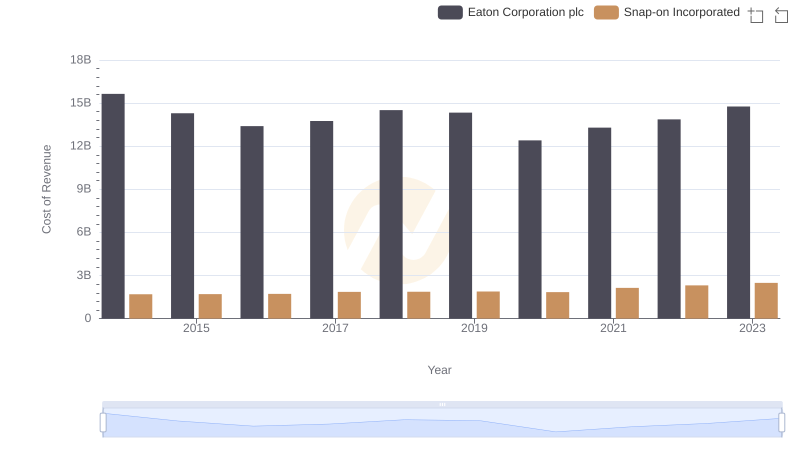
Cost of Revenue: Key Insights for Eaton Corporation plc and Snap-on Incorporated
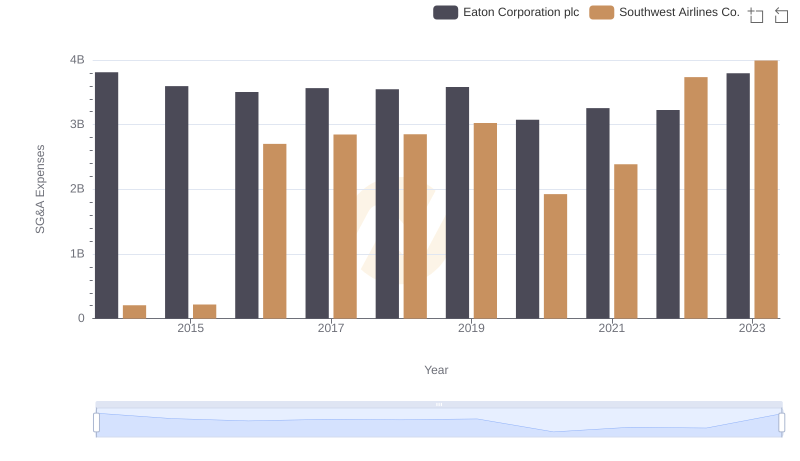
Eaton Corporation plc or Southwest Airlines Co.: Who Manages SG&A Costs Better?