| __timestamp | Eaton Corporation plc | Lennox International Inc. |
|---|---|---|
| Wednesday, January 1, 2014 | 15646000000 | 2464100000 |
| Thursday, January 1, 2015 | 14292000000 | 2520000000 |
| Friday, January 1, 2016 | 13400000000 | 2565100000 |
| Sunday, January 1, 2017 | 13756000000 | 2714400000 |
| Monday, January 1, 2018 | 14511000000 | 2772700000 |
| Tuesday, January 1, 2019 | 14338000000 | 2727400000 |
| Wednesday, January 1, 2020 | 12408000000 | 2594000000 |
| Friday, January 1, 2021 | 13293000000 | 3005700000 |
| Saturday, January 1, 2022 | 13865000000 | 3433700000 |
| Sunday, January 1, 2023 | 14763000000 | 3434100000 |
| Monday, January 1, 2024 | 15375000000 | 3569400000 |
Infusing magic into the data realm
In the ever-evolving landscape of industrial manufacturing, understanding cost dynamics is crucial. Over the past decade, Eaton Corporation plc and Lennox International Inc. have showcased distinct trends in their cost of revenue. From 2014 to 2023, Eaton's cost of revenue fluctuated, peaking in 2014 and 2023, with a notable dip in 2020, reflecting a 21% decrease from its 2014 high. This could be attributed to global economic shifts and strategic cost management. Meanwhile, Lennox International Inc. demonstrated a steady upward trajectory, with a 45% increase from 2014 to 2023, indicating robust growth and possibly expanding market share. Interestingly, 2024 data for Eaton is missing, suggesting potential reporting delays or strategic changes. These insights highlight the contrasting financial strategies and market responses of these industrial giants, offering valuable lessons for investors and industry analysts alike.
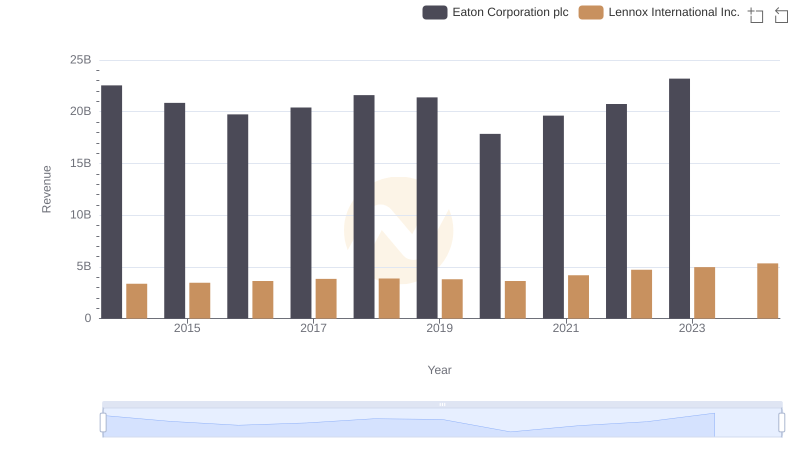
Revenue Insights: Eaton Corporation plc and Lennox International Inc. Performance Compared
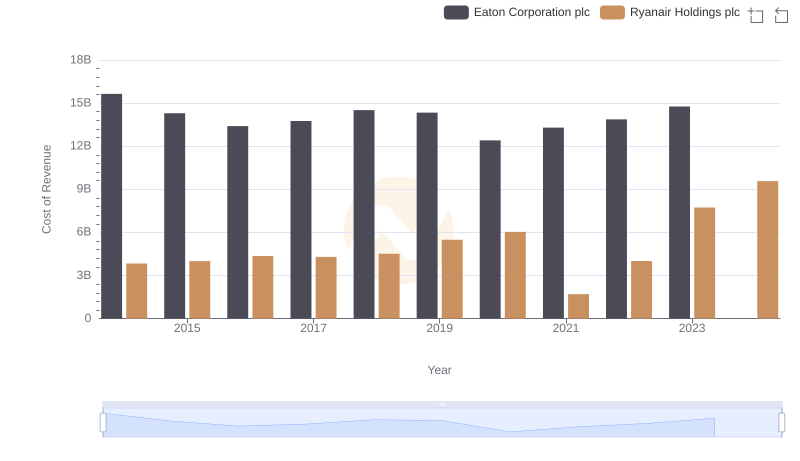
Analyzing Cost of Revenue: Eaton Corporation plc and Ryanair Holdings plc
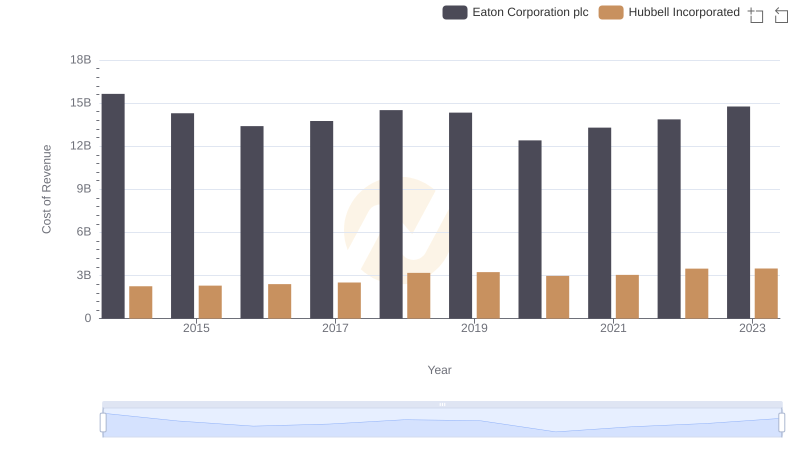
Eaton Corporation plc vs Hubbell Incorporated: Efficiency in Cost of Revenue Explored
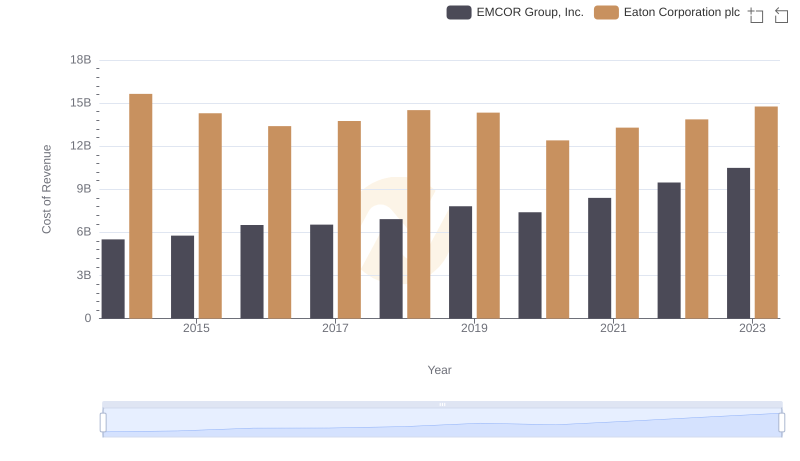
Cost of Revenue: Key Insights for Eaton Corporation plc and EMCOR Group, Inc.
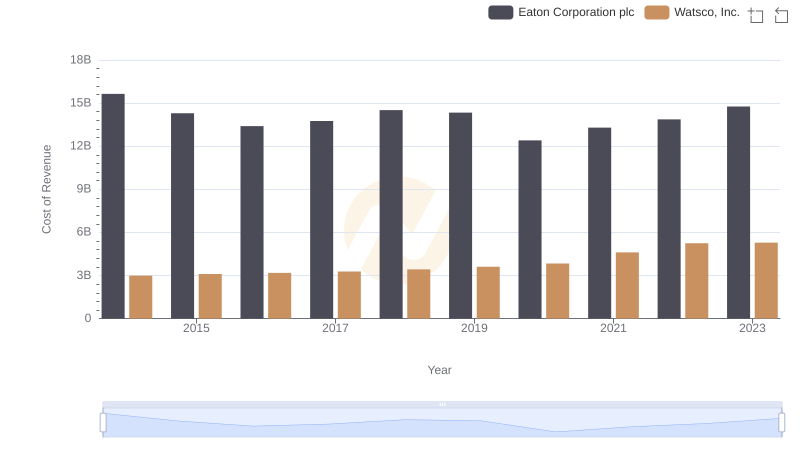
Cost of Revenue Comparison: Eaton Corporation plc vs Watsco, Inc.

Eaton Corporation plc vs AerCap Holdings N.V.: Efficiency in Cost of Revenue Explored
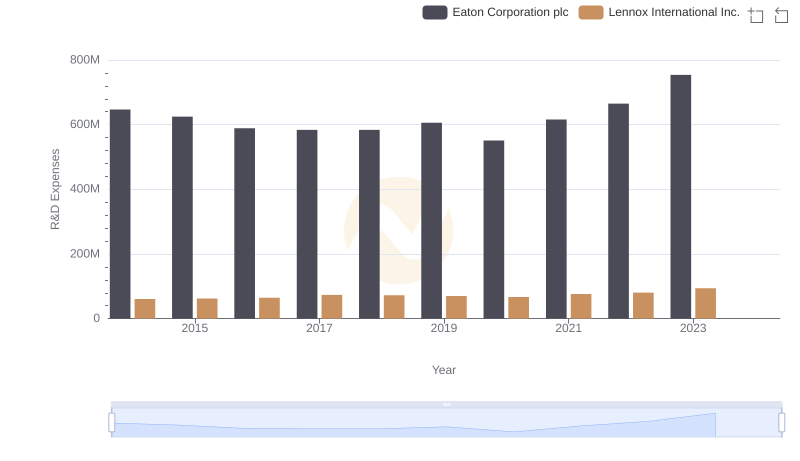
Comparing Innovation Spending: Eaton Corporation plc and Lennox International Inc.

Operational Costs Compared: SG&A Analysis of Eaton Corporation plc and Lennox International Inc.
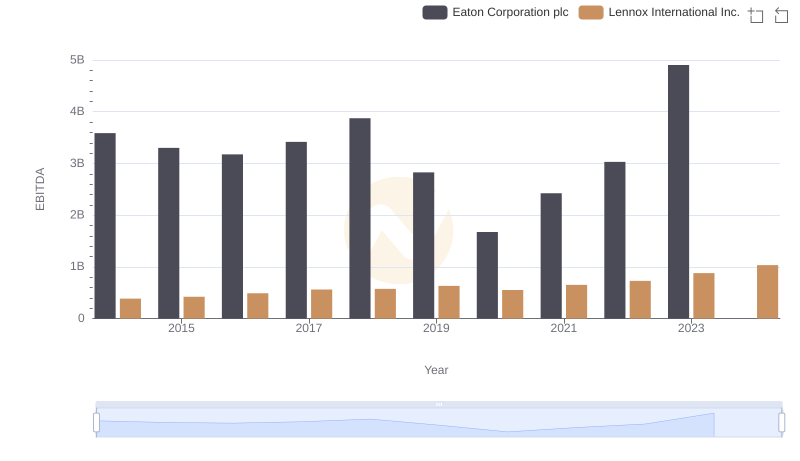
Eaton Corporation plc vs Lennox International Inc.: In-Depth EBITDA Performance Comparison