| __timestamp | AerCap Holdings N.V. | Eaton Corporation plc |
|---|---|---|
| Wednesday, January 1, 2014 | 2252878000 | 15646000000 |
| Thursday, January 1, 2015 | 3776407000 | 14292000000 |
| Friday, January 1, 2016 | 3465727000 | 13400000000 |
| Sunday, January 1, 2017 | 3377439000 | 13756000000 |
| Monday, January 1, 2018 | 3299635000 | 14511000000 |
| Tuesday, January 1, 2019 | 3259091000 | 14338000000 |
| Wednesday, January 1, 2020 | 3217133000 | 12408000000 |
| Friday, January 1, 2021 | 3287413000 | 13293000000 |
| Saturday, January 1, 2022 | 4805277000 | 13865000000 |
| Sunday, January 1, 2023 | 3237016000 | 14763000000 |
| Monday, January 1, 2024 | 15375000000 |
Unveiling the hidden dimensions of data
In the ever-evolving landscape of global business, cost efficiency remains a pivotal factor for success. This analysis delves into the cost of revenue trends for Eaton Corporation plc and AerCap Holdings N.V. from 2014 to 2023. Over this decade, Eaton Corporation consistently maintained a higher cost of revenue, averaging around $14 billion annually, compared to AerCap's $3.4 billion. Notably, Eaton's cost of revenue peaked in 2014, while AerCap saw its highest in 2022, indicating strategic shifts in operational efficiency.
Understanding these trends provides valuable insights into the operational strategies of these industry giants.
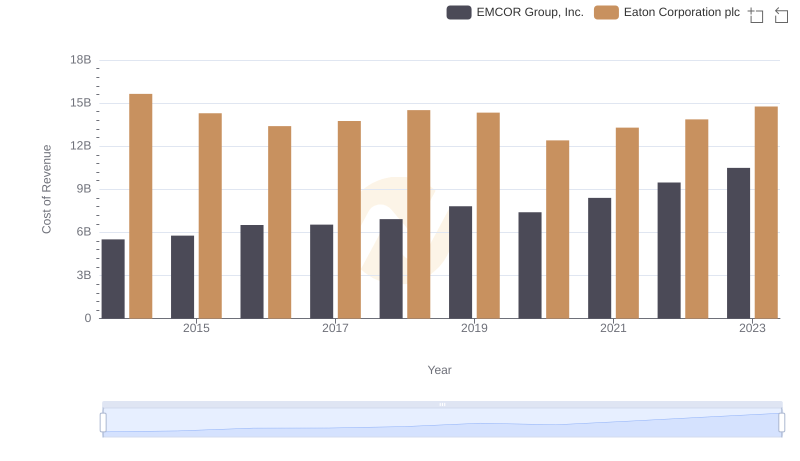
Cost of Revenue: Key Insights for Eaton Corporation plc and EMCOR Group, Inc.
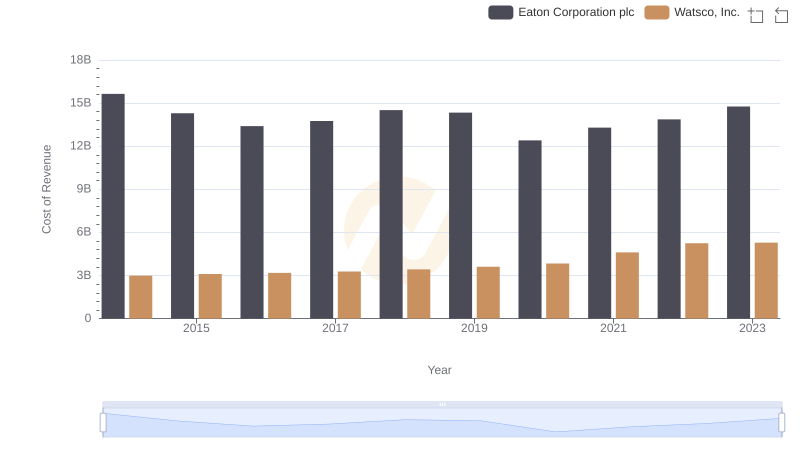
Cost of Revenue Comparison: Eaton Corporation plc vs Watsco, Inc.
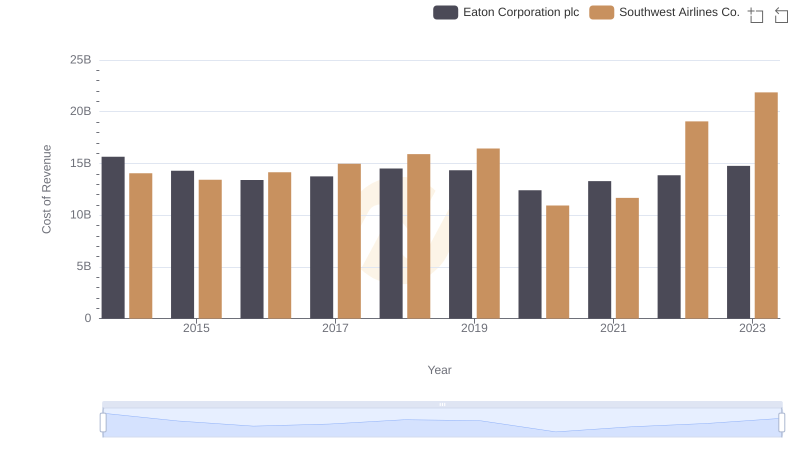
Analyzing Cost of Revenue: Eaton Corporation plc and Southwest Airlines Co.

Comparing Cost of Revenue Efficiency: Eaton Corporation plc vs Stanley Black & Decker, Inc.
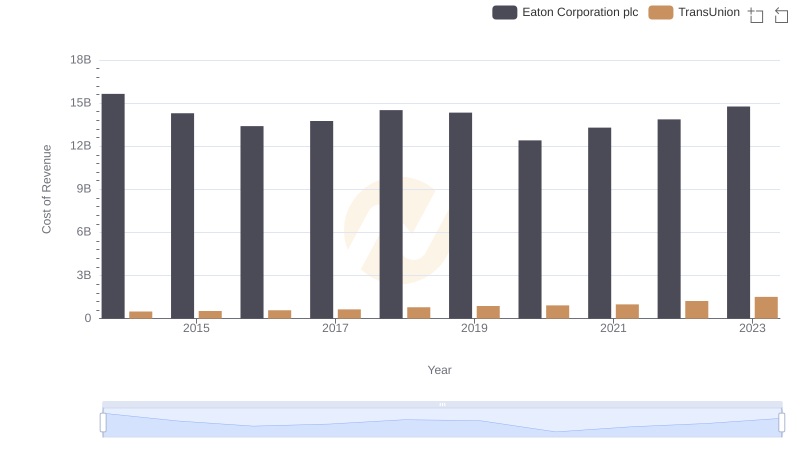
Cost of Revenue Trends: Eaton Corporation plc vs TransUnion
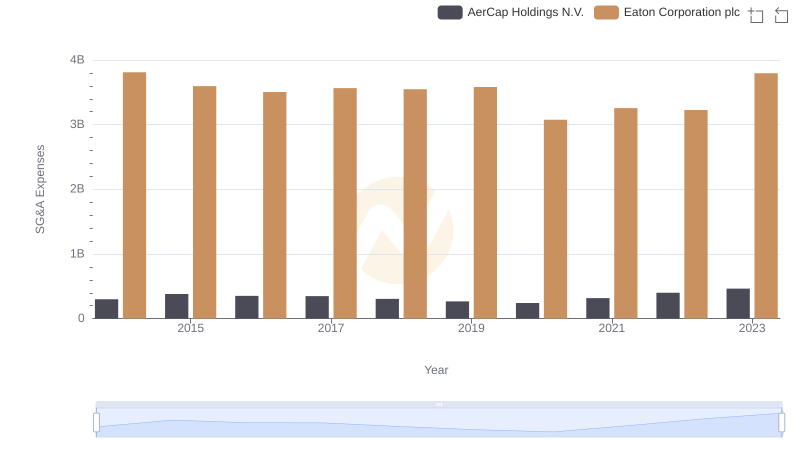
Who Optimizes SG&A Costs Better? Eaton Corporation plc or AerCap Holdings N.V.