| __timestamp | Eaton Corporation plc | Southwest Airlines Co. |
|---|---|---|
| Wednesday, January 1, 2014 | 22552000000 | 18605000000 |
| Thursday, January 1, 2015 | 20855000000 | 19820000000 |
| Friday, January 1, 2016 | 19747000000 | 20425000000 |
| Sunday, January 1, 2017 | 20404000000 | 21171000000 |
| Monday, January 1, 2018 | 21609000000 | 21965000000 |
| Tuesday, January 1, 2019 | 21390000000 | 22428000000 |
| Wednesday, January 1, 2020 | 17858000000 | 9048000000 |
| Friday, January 1, 2021 | 19628000000 | 15790000000 |
| Saturday, January 1, 2022 | 20752000000 | 23814000000 |
| Sunday, January 1, 2023 | 23196000000 | 26091000000 |
| Monday, January 1, 2024 | 24878000000 | 27483000000 |
Data in motion
In the ever-evolving landscape of the corporate world, Eaton Corporation plc and Southwest Airlines Co. have showcased intriguing revenue trajectories over the past decade. From 2014 to 2023, Eaton Corporation plc experienced a steady revenue growth, peaking in 2023 with a 15% increase from its 2014 figures. Meanwhile, Southwest Airlines Co. demonstrated resilience, especially post-2020, where it rebounded from a significant dip due to global disruptions, achieving a remarkable 188% revenue surge by 2023.
Eaton's revenue journey reflects a consistent upward trend, with a slight dip in 2020, likely due to global economic challenges. In contrast, Southwest Airlines faced a more volatile path, with a sharp decline in 2020, but an impressive recovery thereafter. This comparison not only highlights the adaptability of these companies but also underscores the dynamic nature of their respective industries.
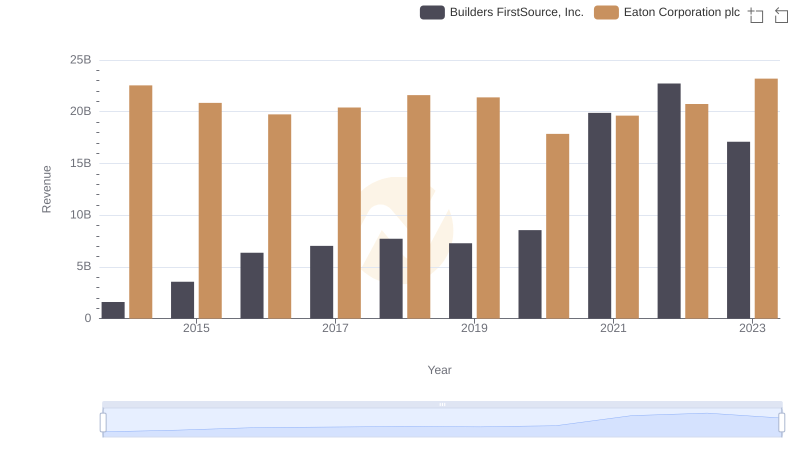
Eaton Corporation plc or Builders FirstSource, Inc.: Who Leads in Yearly Revenue?
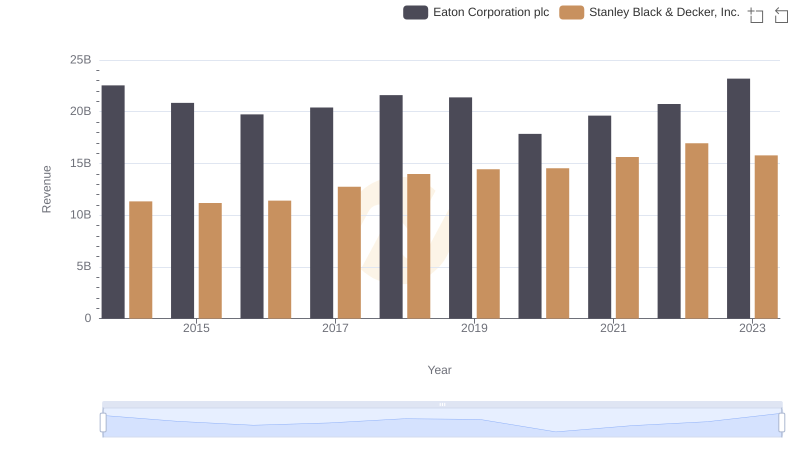
Annual Revenue Comparison: Eaton Corporation plc vs Stanley Black & Decker, Inc.
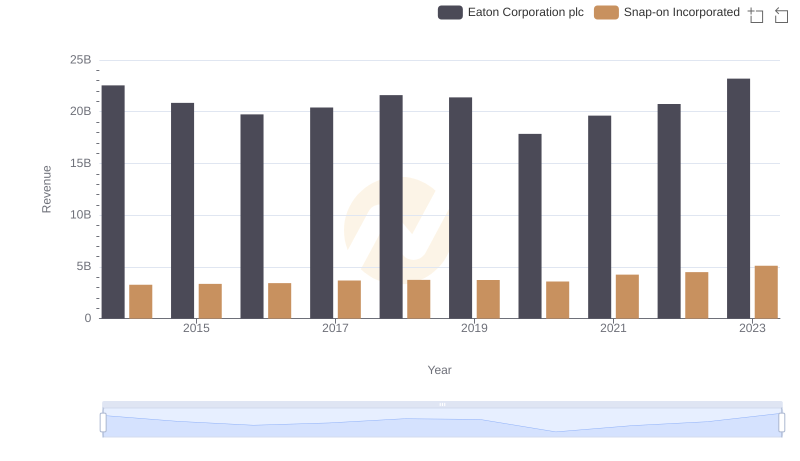
Breaking Down Revenue Trends: Eaton Corporation plc vs Snap-on Incorporated
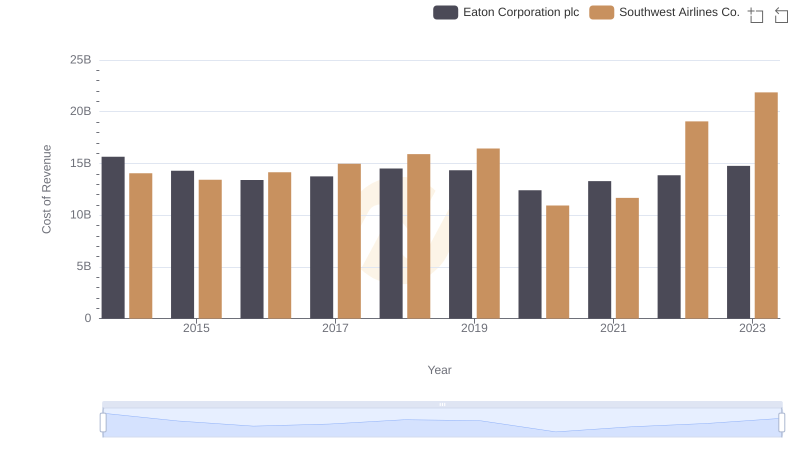
Analyzing Cost of Revenue: Eaton Corporation plc and Southwest Airlines Co.
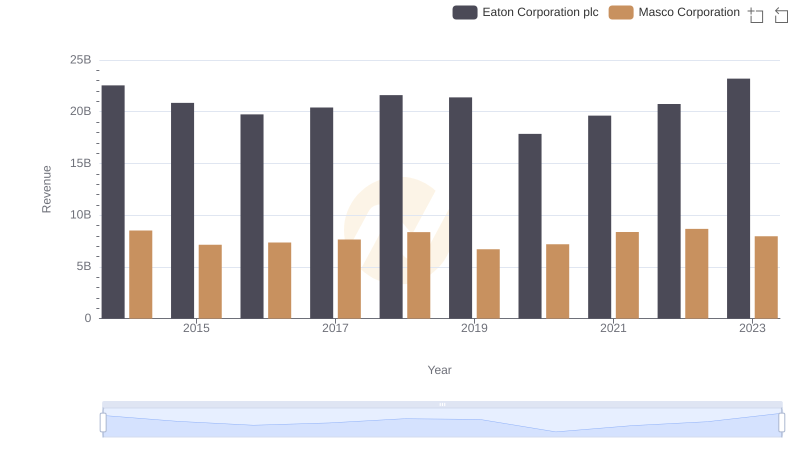
Eaton Corporation plc vs Masco Corporation: Examining Key Revenue Metrics
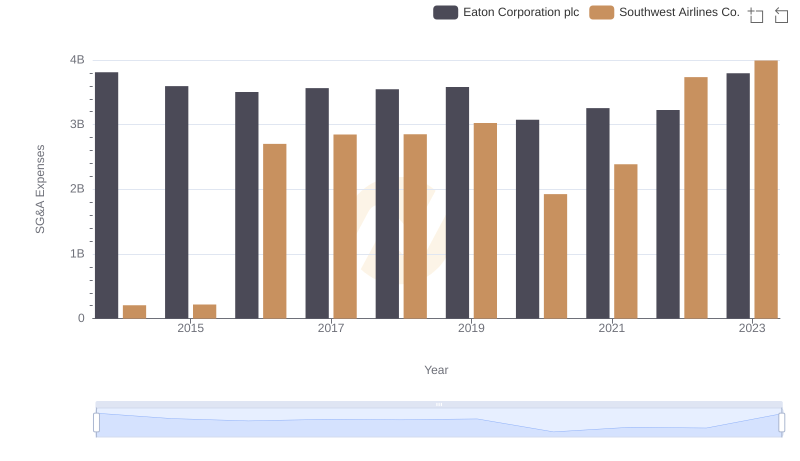
Eaton Corporation plc or Southwest Airlines Co.: Who Manages SG&A Costs Better?