| __timestamp | Eaton Corporation plc | Stanley Black & Decker, Inc. |
|---|---|---|
| Wednesday, January 1, 2014 | 15646000000 | 7235900000 |
| Thursday, January 1, 2015 | 14292000000 | 7099800000 |
| Friday, January 1, 2016 | 13400000000 | 7139700000 |
| Sunday, January 1, 2017 | 13756000000 | 7969200000 |
| Monday, January 1, 2018 | 14511000000 | 9080500000 |
| Tuesday, January 1, 2019 | 14338000000 | 9636700000 |
| Wednesday, January 1, 2020 | 12408000000 | 9566700000 |
| Friday, January 1, 2021 | 13293000000 | 10423000000 |
| Saturday, January 1, 2022 | 13865000000 | 12663300000 |
| Sunday, January 1, 2023 | 14763000000 | 11683100000 |
| Monday, January 1, 2024 | 15375000000 | 10851300000 |
Infusing magic into the data realm
In the ever-evolving landscape of industrial manufacturing, cost efficiency remains a pivotal factor for success. Over the past decade, Eaton Corporation plc and Stanley Black & Decker, Inc. have showcased contrasting trajectories in managing their cost of revenue. From 2014 to 2023, Eaton consistently maintained a higher cost of revenue, peaking in 2014 with a 56% lead over Stanley Black & Decker. However, Stanley Black & Decker demonstrated remarkable growth, reducing the gap significantly by 2022, when their cost of revenue surged by 77% compared to 2014. This trend highlights Stanley Black & Decker's aggressive expansion and operational scaling. Meanwhile, Eaton's cost efficiency remained relatively stable, reflecting a more conservative growth strategy. As we look to the future, these trends offer valuable insights into the strategic priorities and market positioning of these industrial giants.
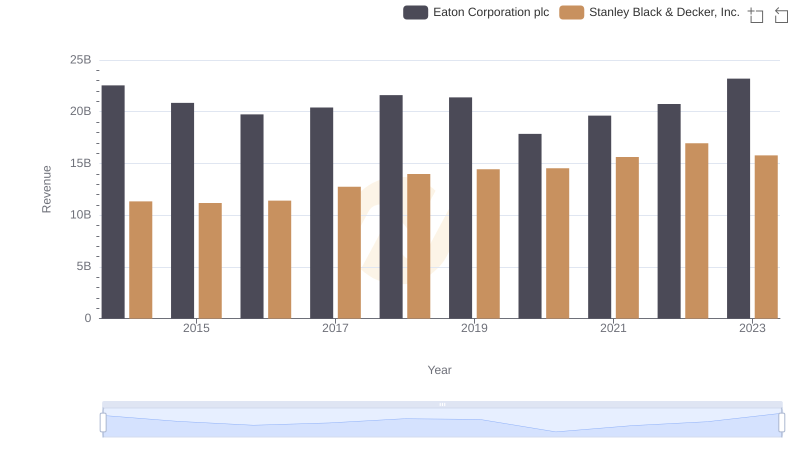
Annual Revenue Comparison: Eaton Corporation plc vs Stanley Black & Decker, Inc.
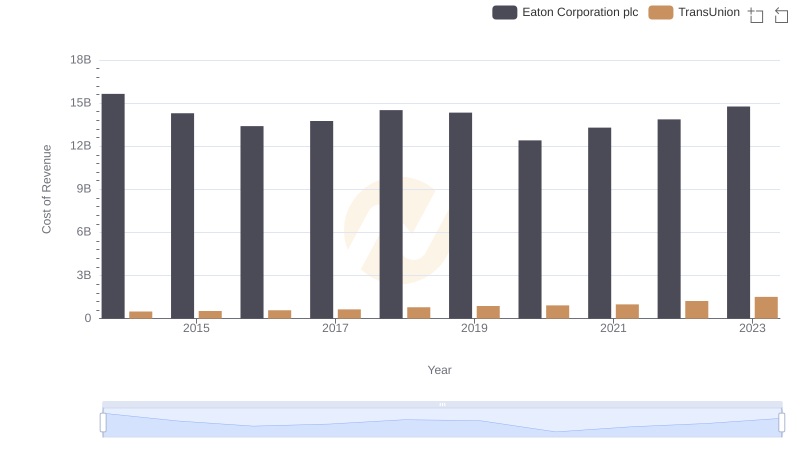
Cost of Revenue Trends: Eaton Corporation plc vs TransUnion
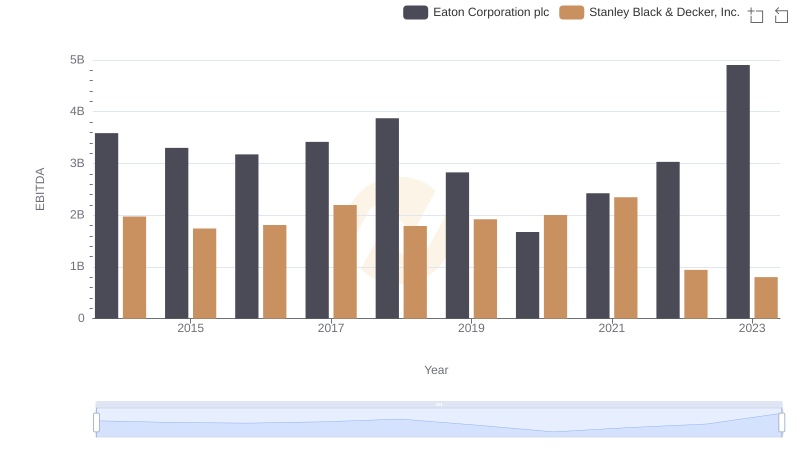
Professional EBITDA Benchmarking: Eaton Corporation plc vs Stanley Black & Decker, Inc.
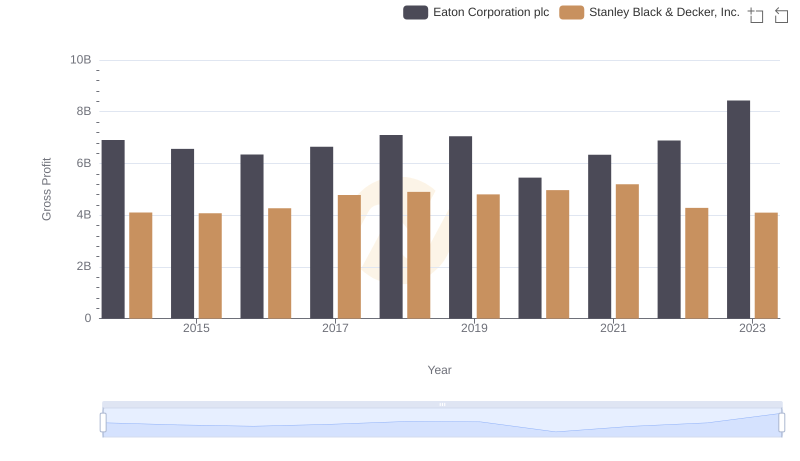
Gross Profit Trends Compared: Eaton Corporation plc vs Stanley Black & Decker, Inc.
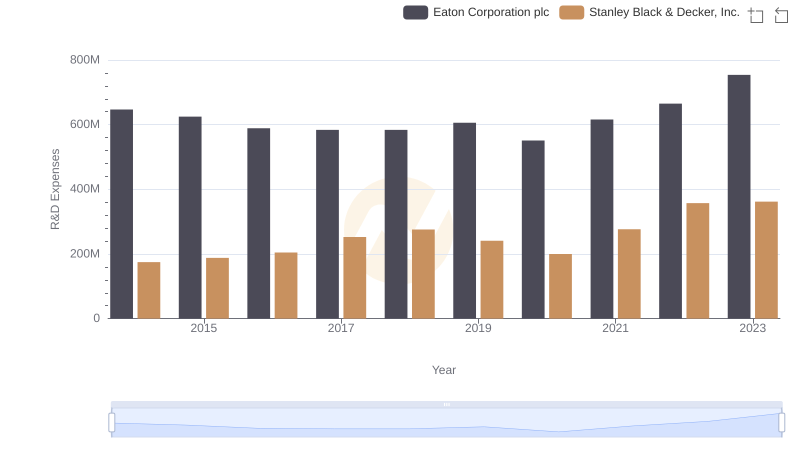
Analyzing R&D Budgets: Eaton Corporation plc vs Stanley Black & Decker, Inc.
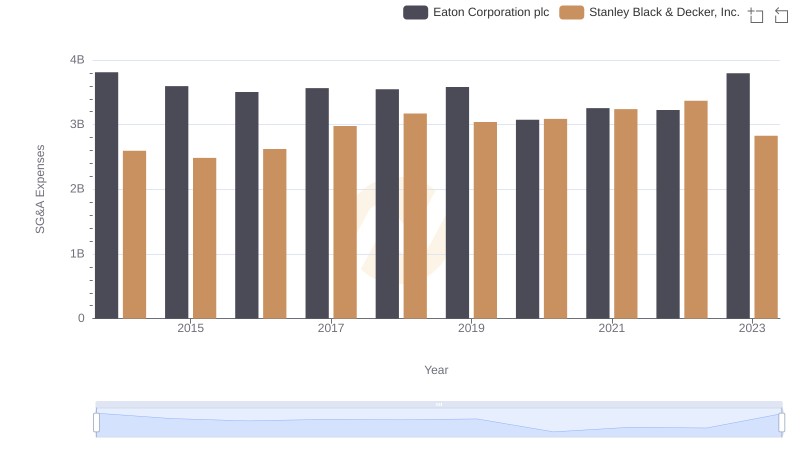
Selling, General, and Administrative Costs: Eaton Corporation plc vs Stanley Black & Decker, Inc.

Eaton Corporation plc and Stanley Black & Decker, Inc.: A Detailed Examination of EBITDA Performance