| __timestamp | Eaton Corporation plc | Snap-on Incorporated |
|---|---|---|
| Wednesday, January 1, 2014 | 15646000000 | 1693400000 |
| Thursday, January 1, 2015 | 14292000000 | 1704500000 |
| Friday, January 1, 2016 | 13400000000 | 1720800000 |
| Sunday, January 1, 2017 | 13756000000 | 1862000000 |
| Monday, January 1, 2018 | 14511000000 | 1870700000 |
| Tuesday, January 1, 2019 | 14338000000 | 1886000000 |
| Wednesday, January 1, 2020 | 12408000000 | 1844000000 |
| Friday, January 1, 2021 | 13293000000 | 2141200000 |
| Saturday, January 1, 2022 | 13865000000 | 2311700000 |
| Sunday, January 1, 2023 | 14763000000 | 2488500000 |
| Monday, January 1, 2024 | 15375000000 | 2329500000 |
Unveiling the hidden dimensions of data
In the ever-evolving landscape of industrial manufacturing, understanding cost dynamics is crucial. Eaton Corporation plc and Snap-on Incorporated, two giants in their respective fields, have shown intriguing trends in their cost of revenue over the past decade. From 2014 to 2023, Eaton's cost of revenue has fluctuated, peaking in 2014 and showing a notable dip in 2020, likely due to global economic disruptions. However, by 2023, Eaton's costs rebounded by approximately 19% from the 2020 low, reflecting strategic adjustments and market recovery.
Snap-on Incorporated, on the other hand, has demonstrated a steady upward trajectory in its cost of revenue, with a significant 47% increase from 2014 to 2023. This growth underscores Snap-on's expanding market presence and operational scale. These insights not only highlight the resilience and adaptability of these companies but also provide a window into broader industry trends.

Eaton Corporation plc vs AerCap Holdings N.V.: Efficiency in Cost of Revenue Explored
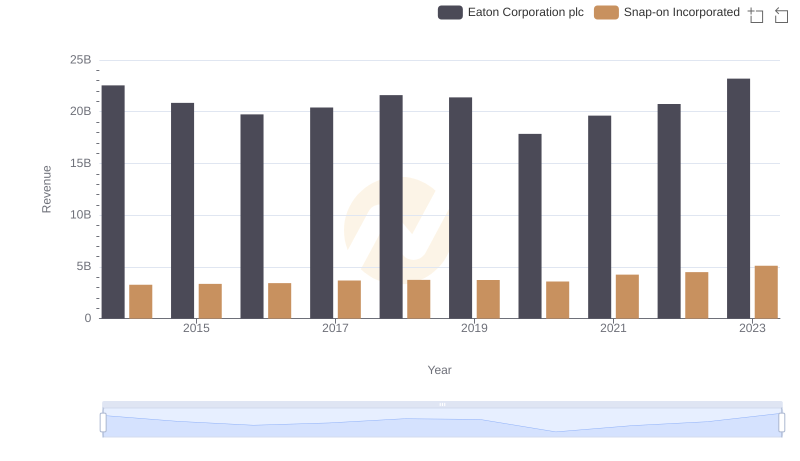
Breaking Down Revenue Trends: Eaton Corporation plc vs Snap-on Incorporated
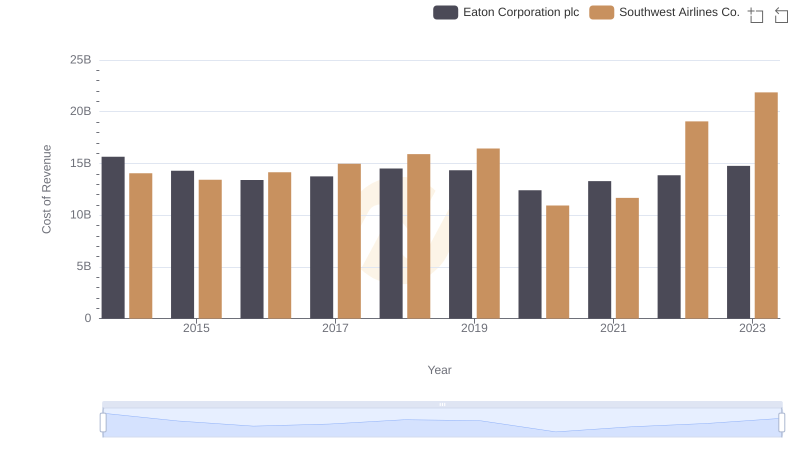
Analyzing Cost of Revenue: Eaton Corporation plc and Southwest Airlines Co.

Comparing Cost of Revenue Efficiency: Eaton Corporation plc vs Stanley Black & Decker, Inc.
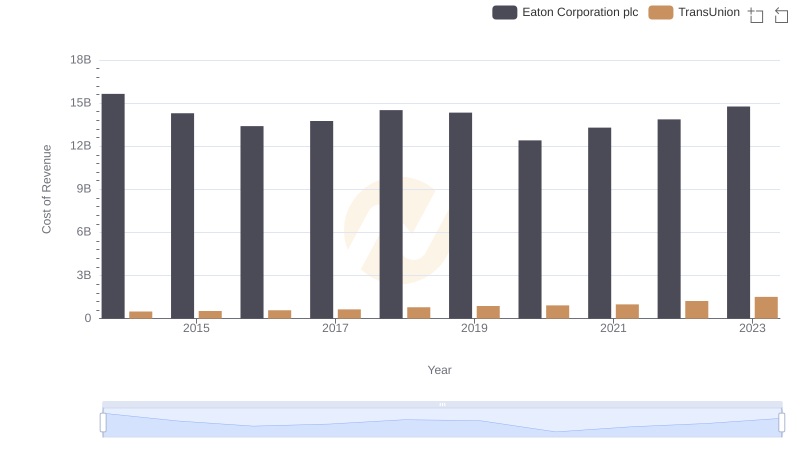
Cost of Revenue Trends: Eaton Corporation plc vs TransUnion
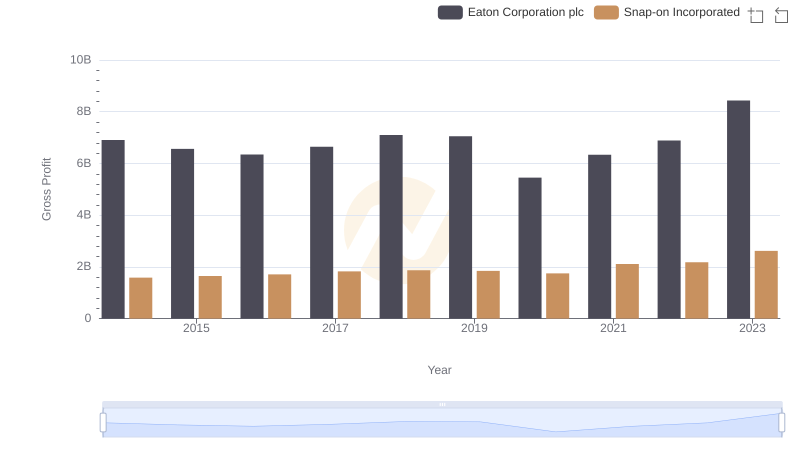
Eaton Corporation plc vs Snap-on Incorporated: A Gross Profit Performance Breakdown
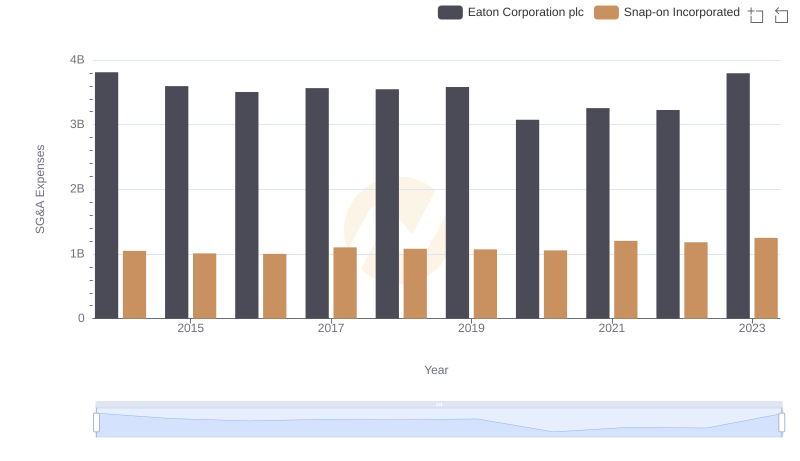
SG&A Efficiency Analysis: Comparing Eaton Corporation plc and Snap-on Incorporated