| __timestamp | Eaton Corporation plc | Watsco, Inc. |
|---|---|---|
| Wednesday, January 1, 2014 | 15646000000 | 2988138000 |
| Thursday, January 1, 2015 | 14292000000 | 3105882000 |
| Friday, January 1, 2016 | 13400000000 | 3186118000 |
| Sunday, January 1, 2017 | 13756000000 | 3276296000 |
| Monday, January 1, 2018 | 14511000000 | 3426401000 |
| Tuesday, January 1, 2019 | 14338000000 | 3613406000 |
| Wednesday, January 1, 2020 | 12408000000 | 3832107000 |
| Friday, January 1, 2021 | 13293000000 | 4612647000 |
| Saturday, January 1, 2022 | 13865000000 | 5244055000 |
| Sunday, January 1, 2023 | 14763000000 | 5291627000 |
| Monday, January 1, 2024 | 15375000000 | 5573604000 |
Unveiling the hidden dimensions of data
In the world of industrial and distribution sectors, Eaton Corporation plc and Watsco, Inc. stand as titans. Over the past decade, Eaton's cost of revenue has shown a steady trend, peaking in 2014 and 2023, with a notable dip in 2020. This dip, likely influenced by global economic shifts, saw Eaton's cost of revenue drop by approximately 21% from its 2014 high. Meanwhile, Watsco, Inc. has experienced a remarkable upward trajectory, with its cost of revenue increasing by nearly 77% from 2014 to 2023. This growth reflects Watsco's expanding market presence and strategic investments. The data reveals a fascinating contrast: while Eaton's cost of revenue remains relatively stable, Watsco's aggressive growth strategy is evident. As these companies navigate the complexities of their industries, their financial strategies offer valuable insights into their operational efficiencies and market dynamics.
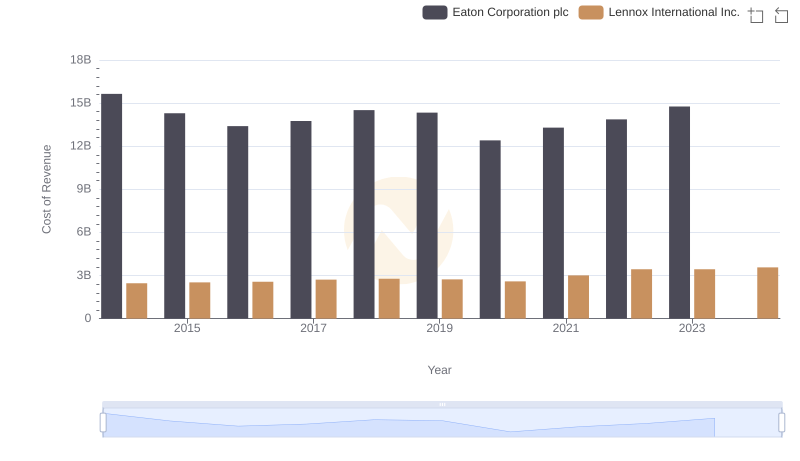
Analyzing Cost of Revenue: Eaton Corporation plc and Lennox International Inc.
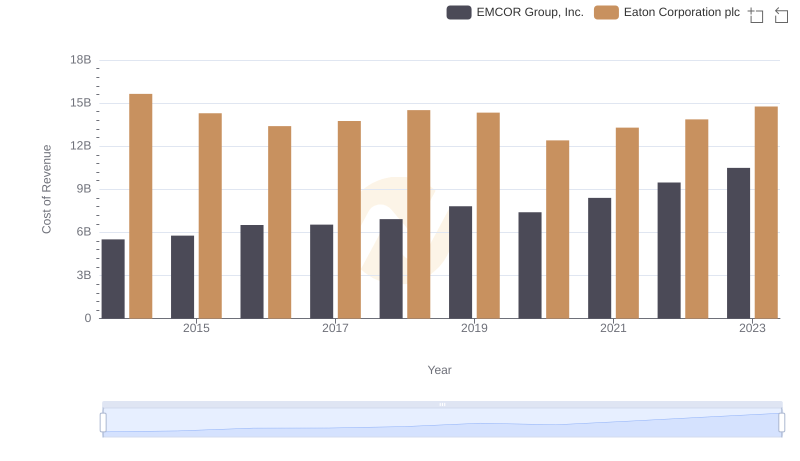
Cost of Revenue: Key Insights for Eaton Corporation plc and EMCOR Group, Inc.

Eaton Corporation plc vs AerCap Holdings N.V.: Efficiency in Cost of Revenue Explored
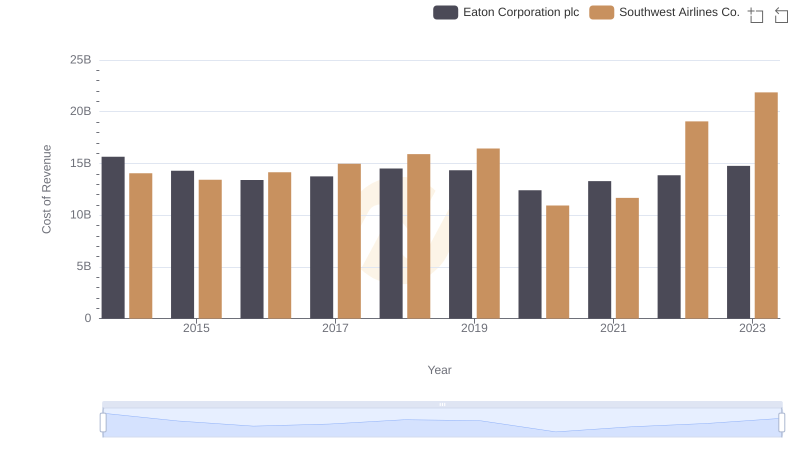
Analyzing Cost of Revenue: Eaton Corporation plc and Southwest Airlines Co.

Comparing Cost of Revenue Efficiency: Eaton Corporation plc vs Stanley Black & Decker, Inc.
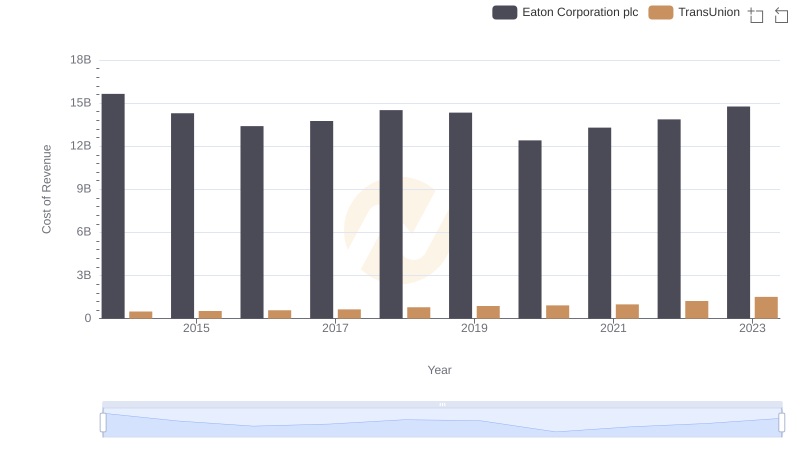
Cost of Revenue Trends: Eaton Corporation plc vs TransUnion
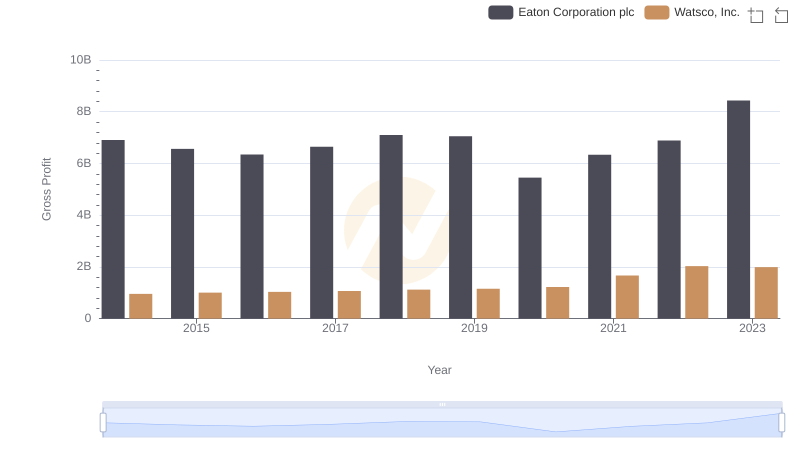
Eaton Corporation plc and Watsco, Inc.: A Detailed Gross Profit Analysis
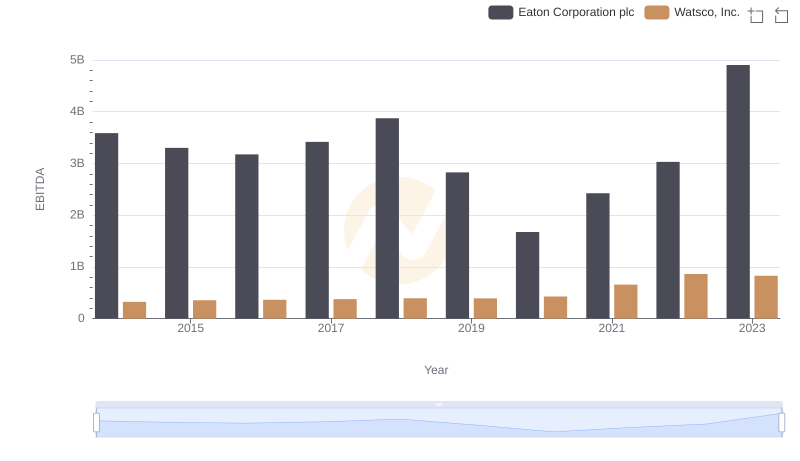
Professional EBITDA Benchmarking: Eaton Corporation plc vs Watsco, Inc.