| __timestamp | Eaton Corporation plc | TransUnion |
|---|---|---|
| Wednesday, January 1, 2014 | 15646000000 | 499100000 |
| Thursday, January 1, 2015 | 14292000000 | 531600000 |
| Friday, January 1, 2016 | 13400000000 | 579100000 |
| Sunday, January 1, 2017 | 13756000000 | 645700000 |
| Monday, January 1, 2018 | 14511000000 | 790100000 |
| Tuesday, January 1, 2019 | 14338000000 | 874100000 |
| Wednesday, January 1, 2020 | 12408000000 | 920400000 |
| Friday, January 1, 2021 | 13293000000 | 991600000 |
| Saturday, January 1, 2022 | 13865000000 | 1222900000 |
| Sunday, January 1, 2023 | 14763000000 | 1517300000 |
| Monday, January 1, 2024 | 15375000000 | 0 |
Unleashing the power of data
In the ever-evolving landscape of global business, understanding cost structures is crucial. This analysis delves into the cost of revenue trends for Eaton Corporation plc and TransUnion from 2014 to 2023. Eaton, a leader in power management, saw its cost of revenue fluctuate, peaking in 2014 and 2023, with a notable dip in 2020. This reflects a strategic adaptation to market conditions, possibly influenced by global economic shifts. TransUnion, a titan in credit reporting, exhibited a steady upward trajectory, with costs tripling over the decade. This growth mirrors its expanding market footprint and investment in data security. The contrasting trends highlight Eaton's resilience and TransUnion's growth strategy. As businesses navigate post-pandemic realities, these insights offer a window into strategic financial management.
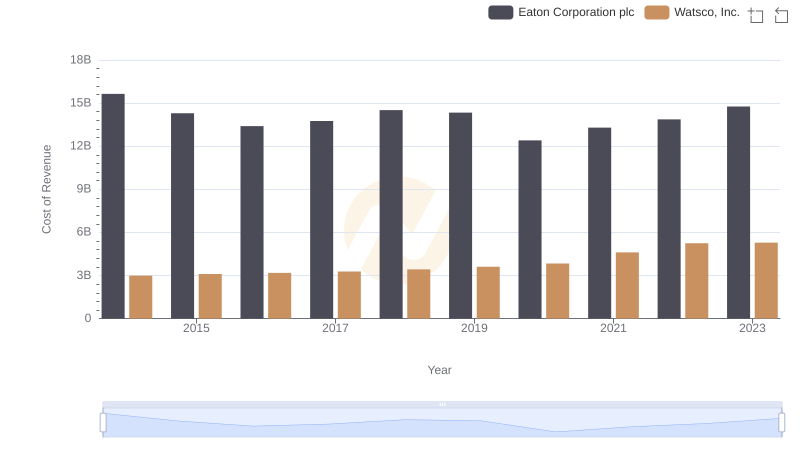
Cost of Revenue Comparison: Eaton Corporation plc vs Watsco, Inc.

Eaton Corporation plc vs AerCap Holdings N.V.: Efficiency in Cost of Revenue Explored
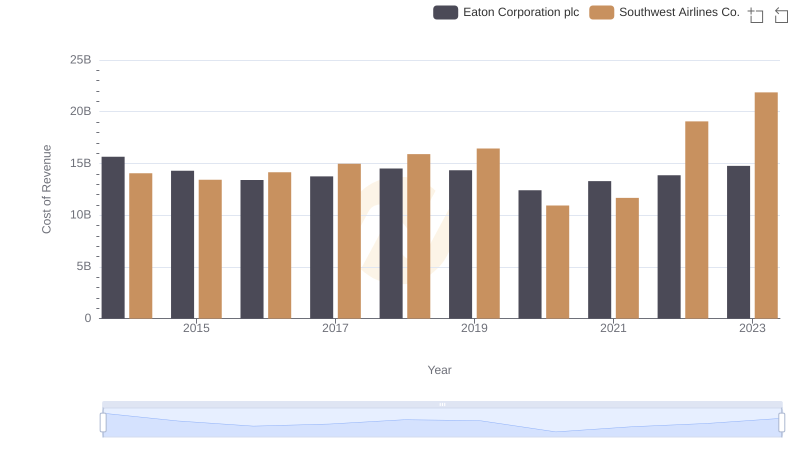
Analyzing Cost of Revenue: Eaton Corporation plc and Southwest Airlines Co.

Comparing Cost of Revenue Efficiency: Eaton Corporation plc vs Stanley Black & Decker, Inc.
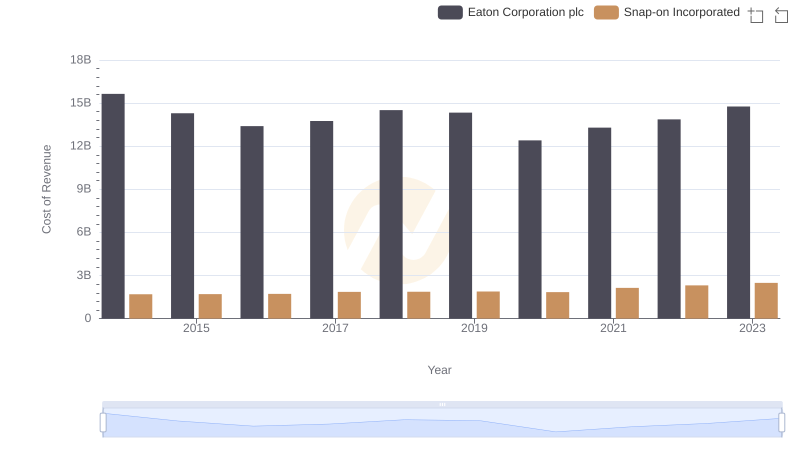
Cost of Revenue: Key Insights for Eaton Corporation plc and Snap-on Incorporated
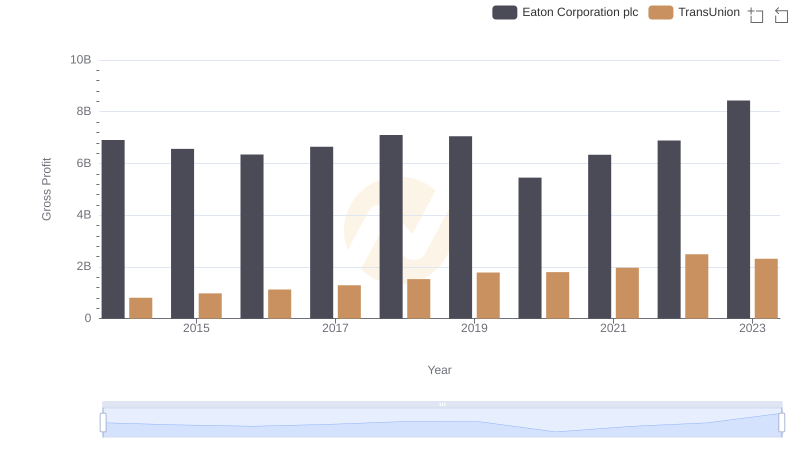
Gross Profit Trends Compared: Eaton Corporation plc vs TransUnion
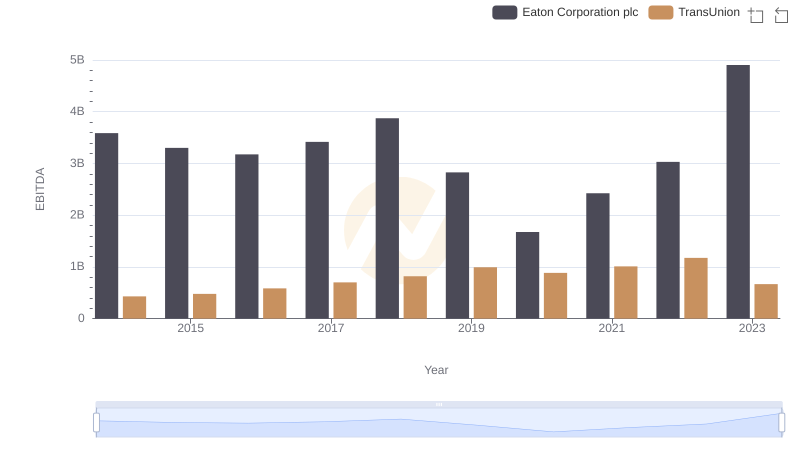
Eaton Corporation plc vs TransUnion: In-Depth EBITDA Performance Comparison