| __timestamp | EMCOR Group, Inc. | Eaton Corporation plc |
|---|---|---|
| Wednesday, January 1, 2014 | 5517719000 | 15646000000 |
| Thursday, January 1, 2015 | 5774247000 | 14292000000 |
| Friday, January 1, 2016 | 6513662000 | 13400000000 |
| Sunday, January 1, 2017 | 6539987000 | 13756000000 |
| Monday, January 1, 2018 | 6925178000 | 14511000000 |
| Tuesday, January 1, 2019 | 7818743000 | 14338000000 |
| Wednesday, January 1, 2020 | 7401679000 | 12408000000 |
| Friday, January 1, 2021 | 8401843000 | 13293000000 |
| Saturday, January 1, 2022 | 9472526000 | 13865000000 |
| Sunday, January 1, 2023 | 10493534000 | 14763000000 |
| Monday, January 1, 2024 | 15375000000 |
Cracking the code
In the ever-evolving landscape of industrial and construction services, understanding cost dynamics is crucial. From 2014 to 2023, Eaton Corporation plc and EMCOR Group, Inc. have shown distinct trends in their cost of revenue. EMCOR Group, Inc. has seen a remarkable 90% increase in its cost of revenue, reflecting its expanding operations and market reach. Meanwhile, Eaton Corporation plc experienced a more modest 6% decrease, indicating strategic cost management amidst fluctuating market conditions.
These insights provide a window into the strategic priorities and operational efficiencies of these industry giants.
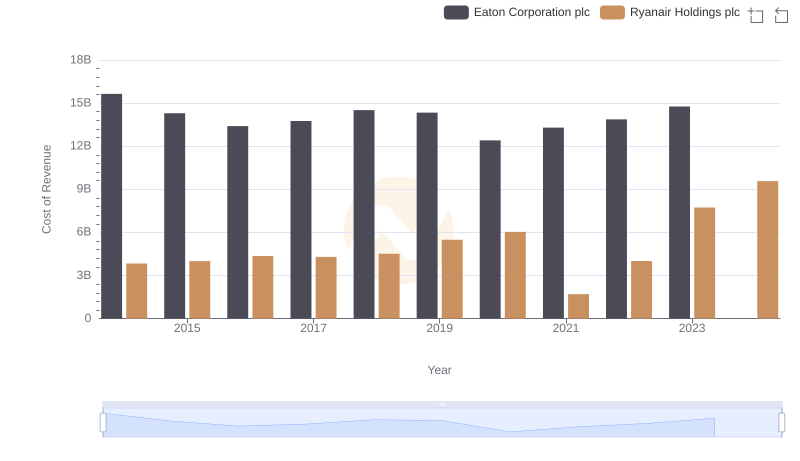
Analyzing Cost of Revenue: Eaton Corporation plc and Ryanair Holdings plc
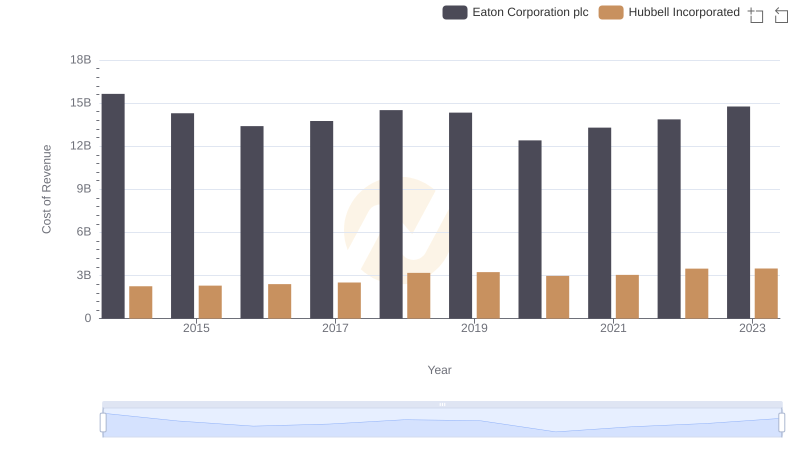
Eaton Corporation plc vs Hubbell Incorporated: Efficiency in Cost of Revenue Explored
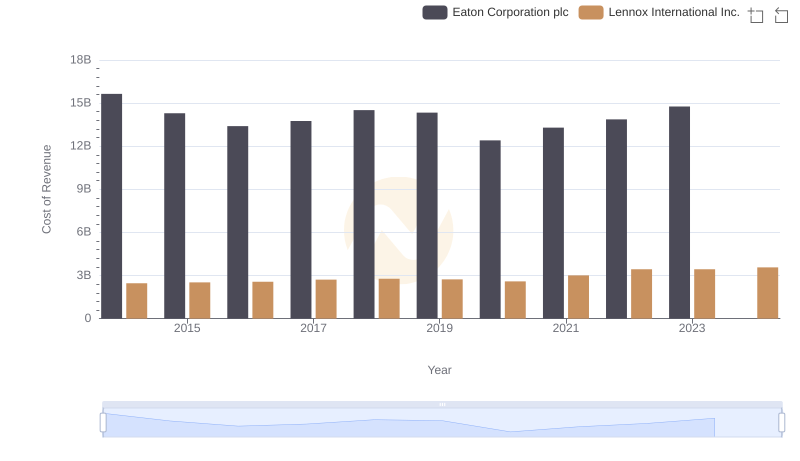
Analyzing Cost of Revenue: Eaton Corporation plc and Lennox International Inc.
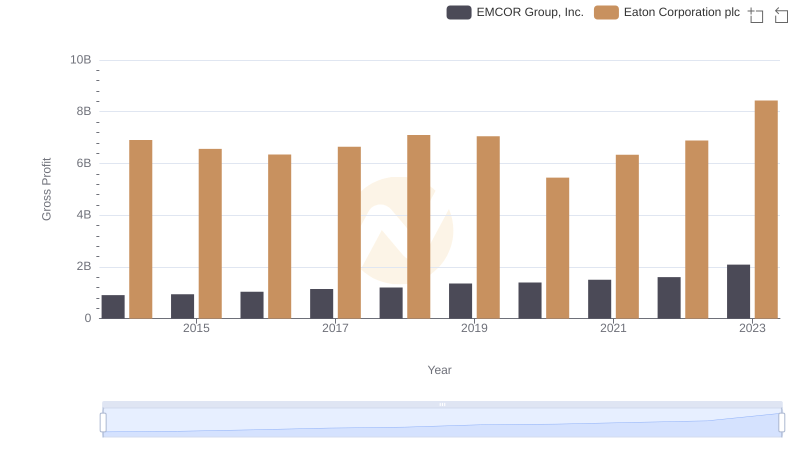
Eaton Corporation plc vs EMCOR Group, Inc.: A Gross Profit Performance Breakdown
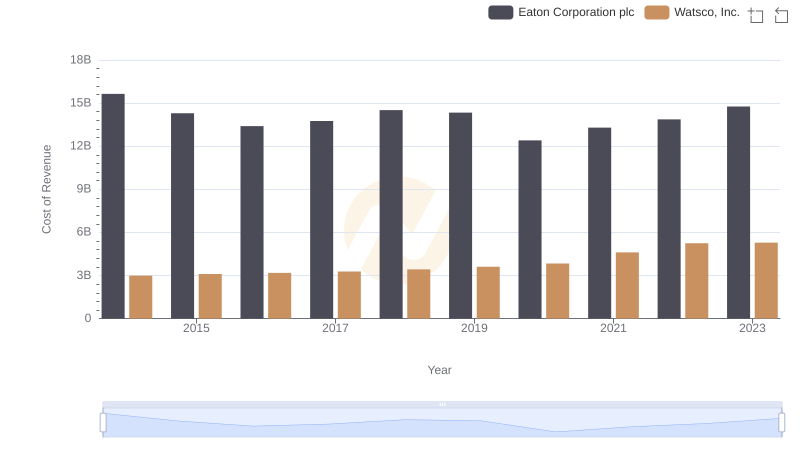
Cost of Revenue Comparison: Eaton Corporation plc vs Watsco, Inc.

Eaton Corporation plc vs AerCap Holdings N.V.: Efficiency in Cost of Revenue Explored
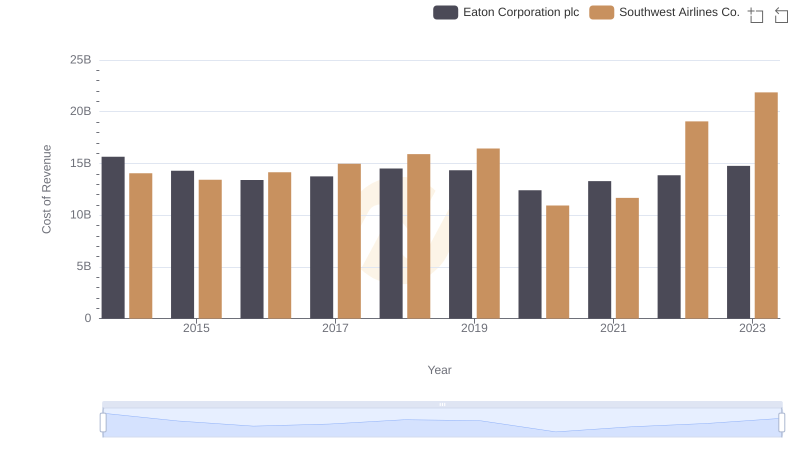
Analyzing Cost of Revenue: Eaton Corporation plc and Southwest Airlines Co.
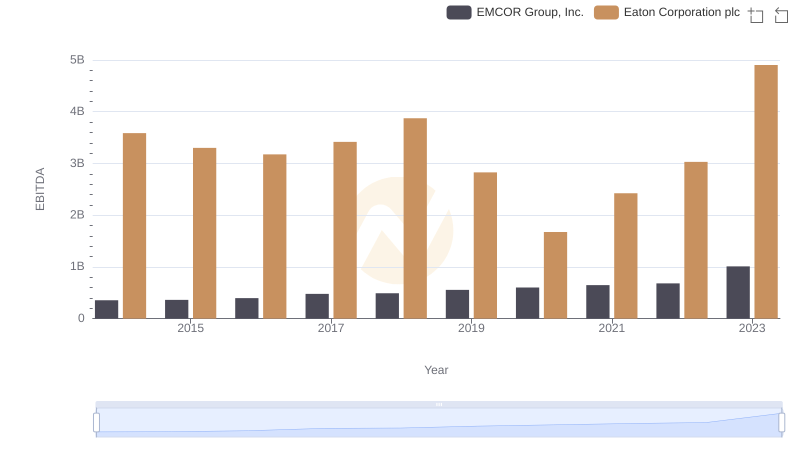
Eaton Corporation plc and EMCOR Group, Inc.: A Detailed Examination of EBITDA Performance