| __timestamp | Cintas Corporation | Clean Harbors, Inc. |
|---|---|---|
| Wednesday, January 1, 2014 | 4551812000 | 3401636000 |
| Thursday, January 1, 2015 | 4476886000 | 3275137000 |
| Friday, January 1, 2016 | 4905458000 | 2755226000 |
| Sunday, January 1, 2017 | 5323381000 | 2944978000 |
| Monday, January 1, 2018 | 6476632000 | 3300303000 |
| Tuesday, January 1, 2019 | 6892303000 | 3412190000 |
| Wednesday, January 1, 2020 | 7085120000 | 3144097000 |
| Friday, January 1, 2021 | 7116340000 | 3805566000 |
| Saturday, January 1, 2022 | 7854459000 | 5166605000 |
| Sunday, January 1, 2023 | 8815769000 | 5409152000 |
| Monday, January 1, 2024 | 9596615000 | 5889952000 |
Data in motion
In the competitive landscape of corporate America, revenue growth is a key indicator of success. Over the past decade, Cintas Corporation and Clean Harbors, Inc. have showcased distinct trajectories in their financial performance. From 2014 to 2023, Cintas Corporation has seen a remarkable revenue increase of over 110%, starting from approximately $4.6 billion and reaching nearly $8.8 billion. This growth underscores Cintas's strategic expansion and market penetration.
Conversely, Clean Harbors, Inc. experienced a more modest growth of around 59% during the same period, with revenues rising from $3.4 billion to $5.4 billion. Notably, data for 2024 is missing for Clean Harbors, highlighting potential gaps in reporting or forecasting. This comparison not only reflects the dynamic nature of the industry but also emphasizes the importance of strategic planning and adaptability in achieving sustained growth.
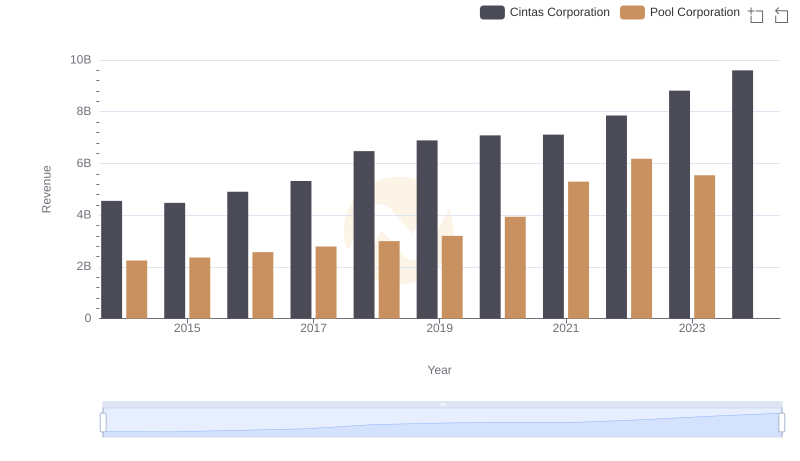
Who Generates More Revenue? Cintas Corporation or Pool Corporation
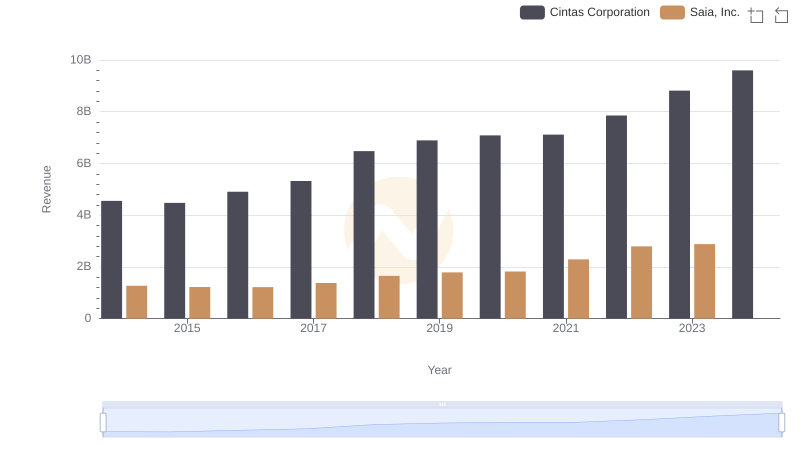
Cintas Corporation vs Saia, Inc.: Examining Key Revenue Metrics
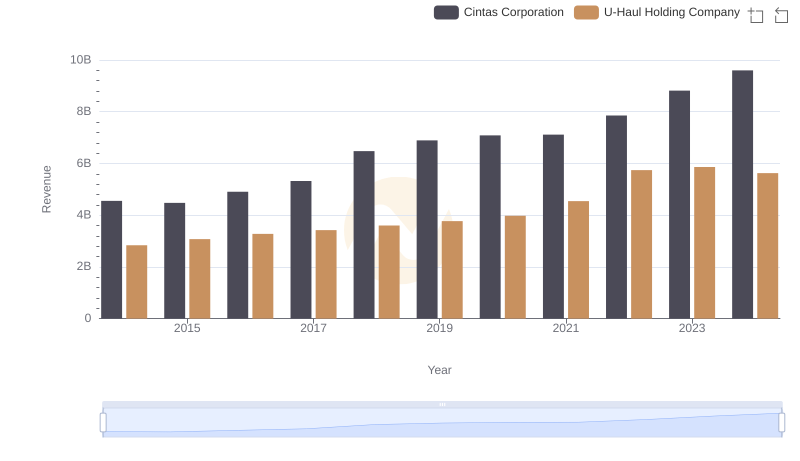
Who Generates More Revenue? Cintas Corporation or U-Haul Holding Company
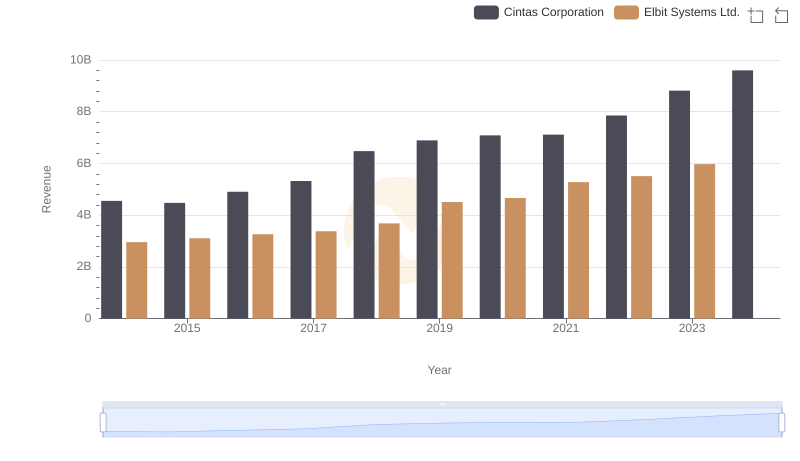
Who Generates More Revenue? Cintas Corporation or Elbit Systems Ltd.
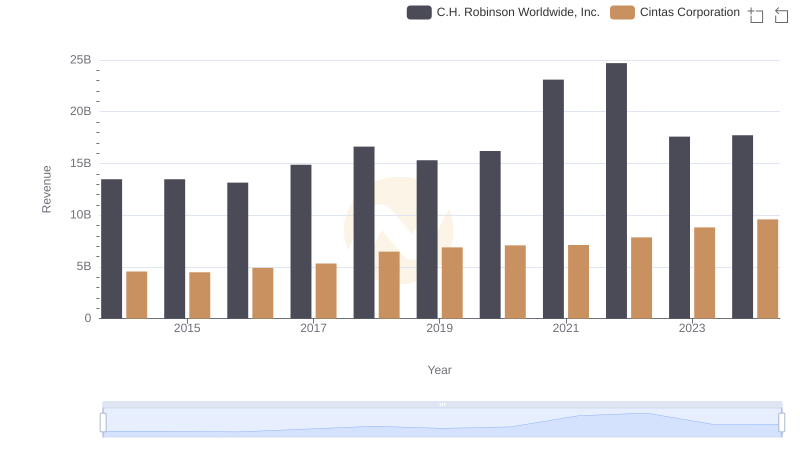
Revenue Showdown: Cintas Corporation vs C.H. Robinson Worldwide, Inc.
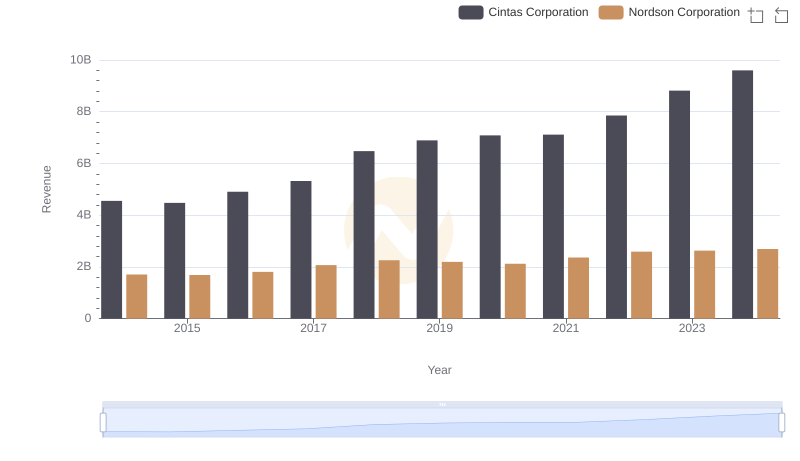
Cintas Corporation vs Nordson Corporation: Annual Revenue Growth Compared
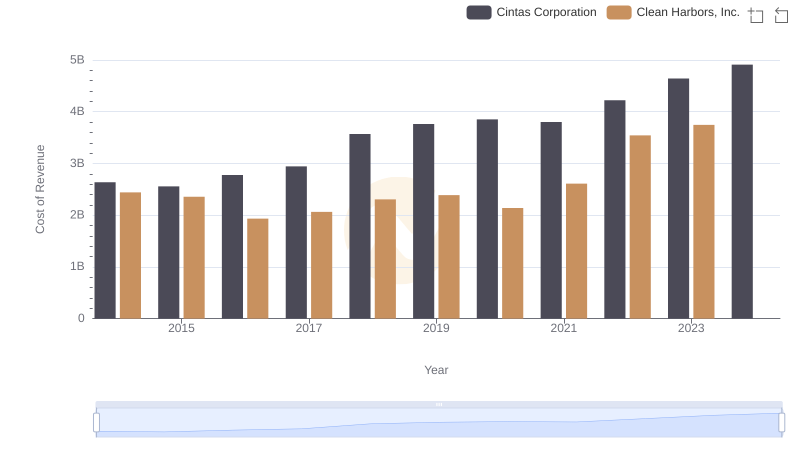
Analyzing Cost of Revenue: Cintas Corporation and Clean Harbors, Inc.
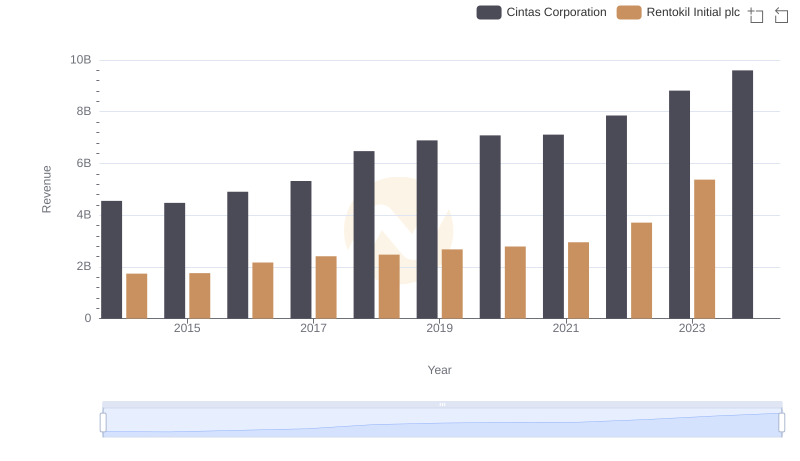
Cintas Corporation vs Rentokil Initial plc: Annual Revenue Growth Compared
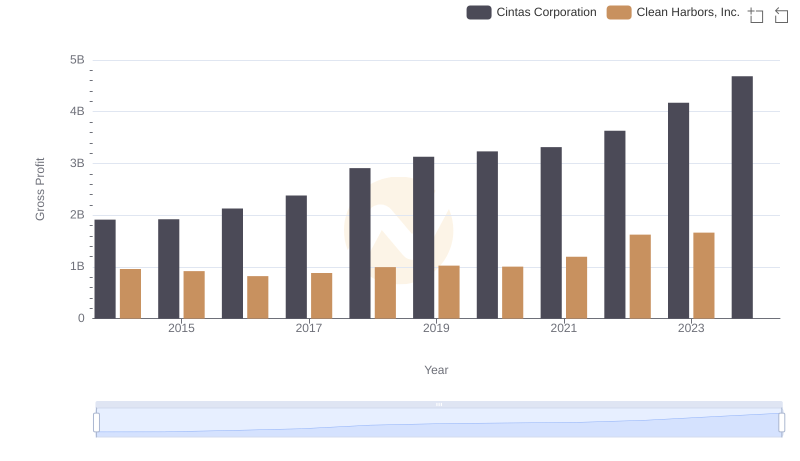
Gross Profit Trends Compared: Cintas Corporation vs Clean Harbors, Inc.