| __timestamp | Cintas Corporation | Clean Harbors, Inc. |
|---|---|---|
| Wednesday, January 1, 2014 | 1914386000 | 959840000 |
| Thursday, January 1, 2015 | 1921337000 | 918331000 |
| Friday, January 1, 2016 | 2129870000 | 822369000 |
| Sunday, January 1, 2017 | 2380295000 | 882305000 |
| Monday, January 1, 2018 | 2908523000 | 994752000 |
| Tuesday, January 1, 2019 | 3128588000 | 1024371000 |
| Wednesday, January 1, 2020 | 3233748000 | 1006346000 |
| Friday, January 1, 2021 | 3314651000 | 1195729000 |
| Saturday, January 1, 2022 | 3632246000 | 1622675000 |
| Sunday, January 1, 2023 | 4173368000 | 1663028000 |
| Monday, January 1, 2024 | 4686416000 | 1824239000 |
Cracking the code
In the competitive landscape of industrial services, Cintas Corporation and Clean Harbors, Inc. have shown distinct trajectories in their gross profit trends over the past decade. Since 2014, Cintas Corporation has demonstrated a robust growth pattern, with its gross profit increasing by approximately 145% by 2023. This upward trend reflects Cintas's strategic expansions and operational efficiencies. In contrast, Clean Harbors, Inc. has experienced a more modest growth of around 73% over the same period, indicating steady but slower progress.
The year 2022 marked a significant milestone for Clean Harbors, with a notable 36% increase in gross profit compared to the previous year, showcasing its resilience and adaptability in a challenging market. However, data for 2024 is missing for Clean Harbors, leaving room for speculation on its future performance. These insights provide a compelling narrative of how these industry giants are navigating the evolving economic landscape.
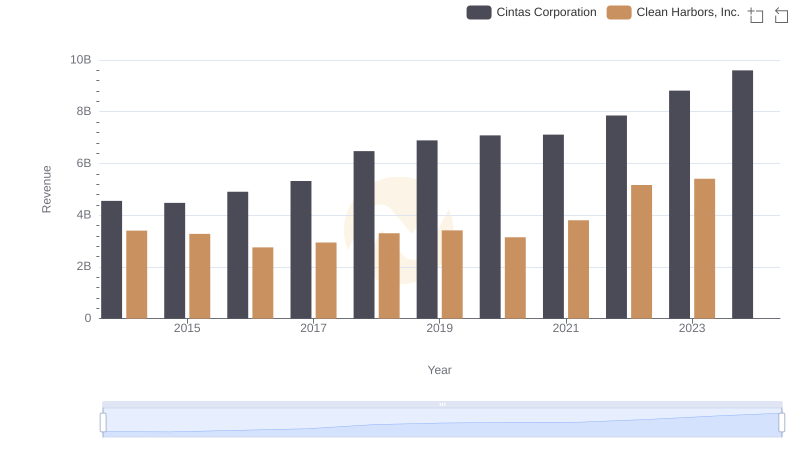
Revenue Insights: Cintas Corporation and Clean Harbors, Inc. Performance Compared
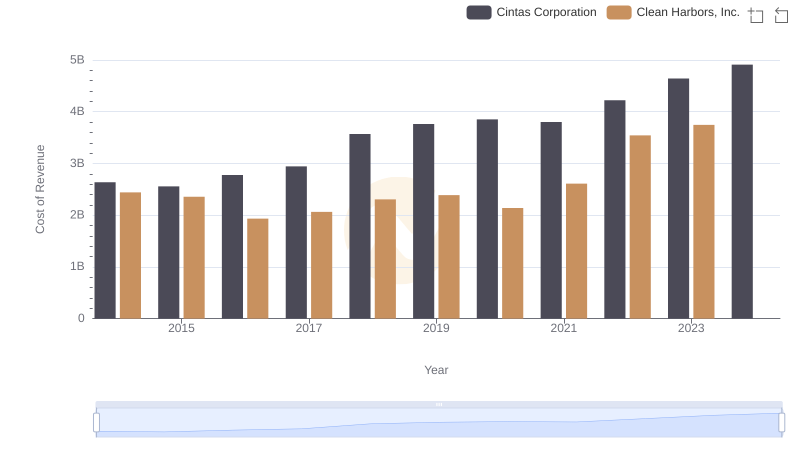
Analyzing Cost of Revenue: Cintas Corporation and Clean Harbors, Inc.
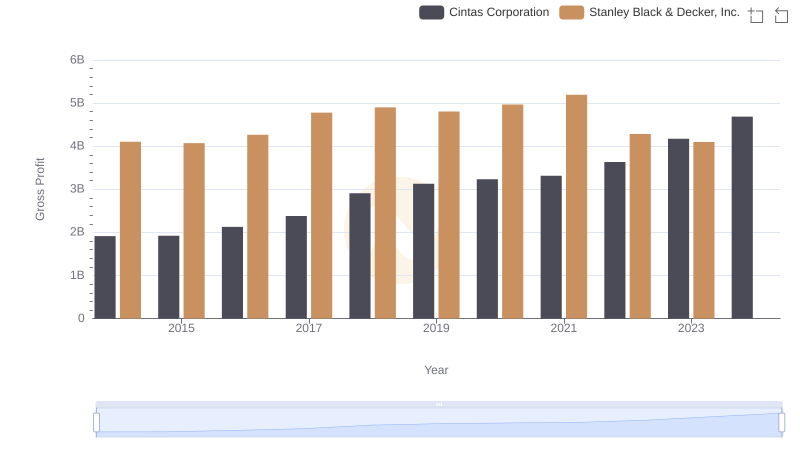
Key Insights on Gross Profit: Cintas Corporation vs Stanley Black & Decker, Inc.
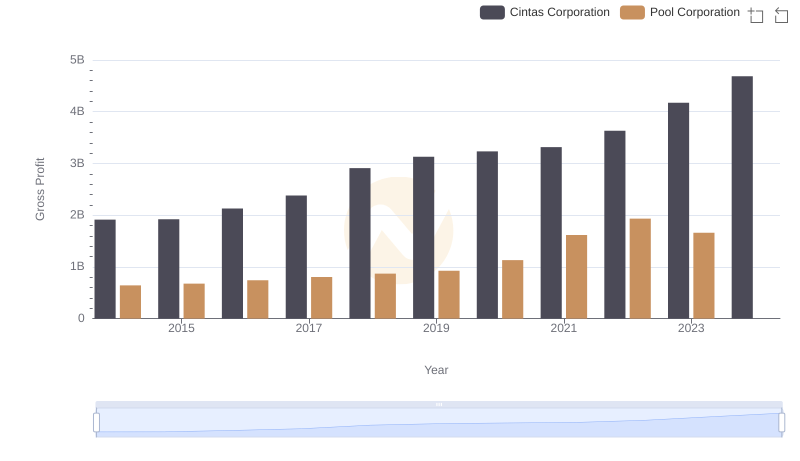
Who Generates Higher Gross Profit? Cintas Corporation or Pool Corporation
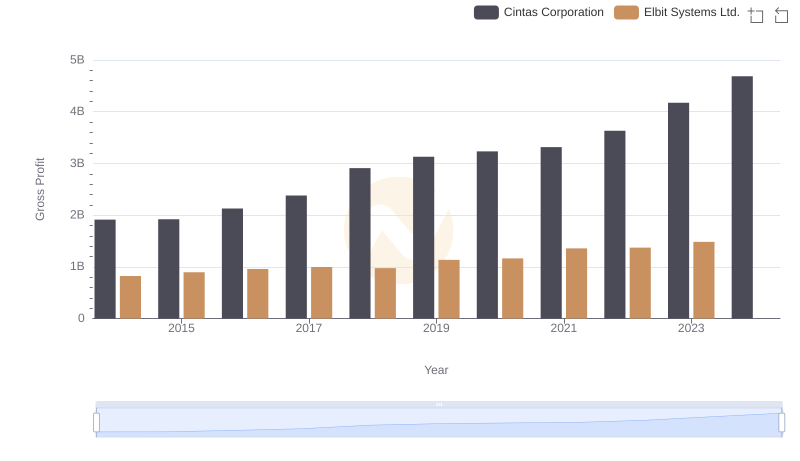
Gross Profit Trends Compared: Cintas Corporation vs Elbit Systems Ltd.
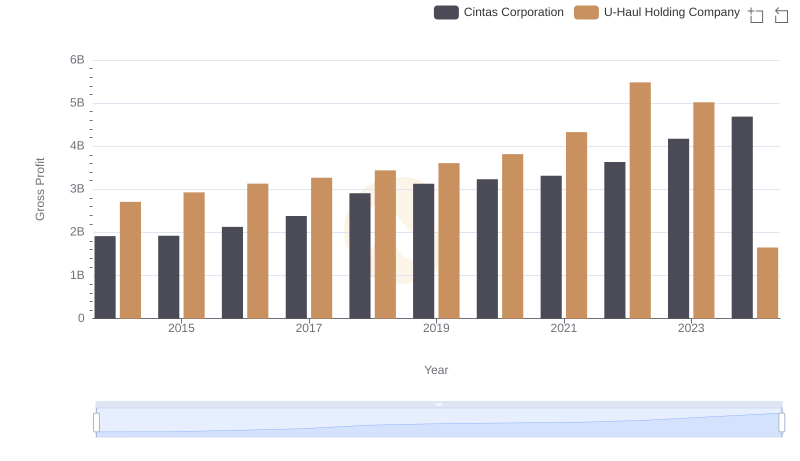
Gross Profit Analysis: Comparing Cintas Corporation and U-Haul Holding Company

Who Generates Higher Gross Profit? Cintas Corporation or Curtiss-Wright Corporation
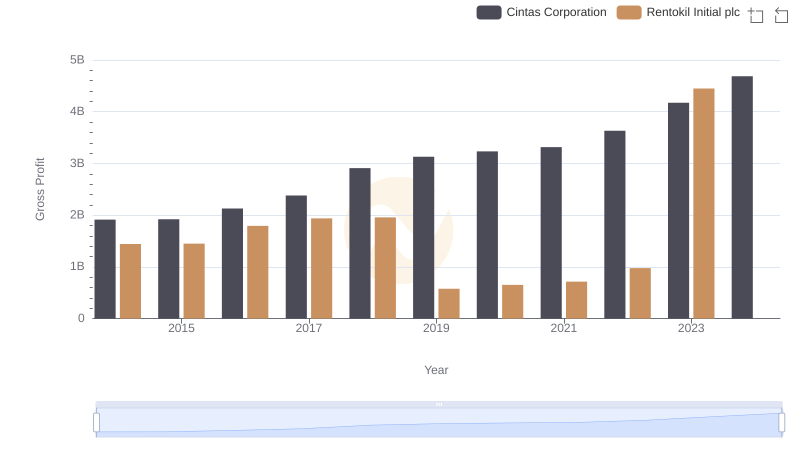
Gross Profit Trends Compared: Cintas Corporation vs Rentokil Initial plc